Representative Sales
On this page
The Representative Sales report shows what the customers of one representative bought, returned and kept in the period, product by product. Use it to see how each representative’s customers are doing.
A customer belongs to a representative when the representative is set on its account, in A/c Grouping (2 C). Customers with no representative are left out. The pictures below use two representatives set there, SRINIVAS and RAVI.
Open the report
Press Alt+7 for Special Reports, then Z for More Special Reports, then D. The report opens for the financial year from its first day to today, for all representatives, with View on Customers and Qty in on Units.
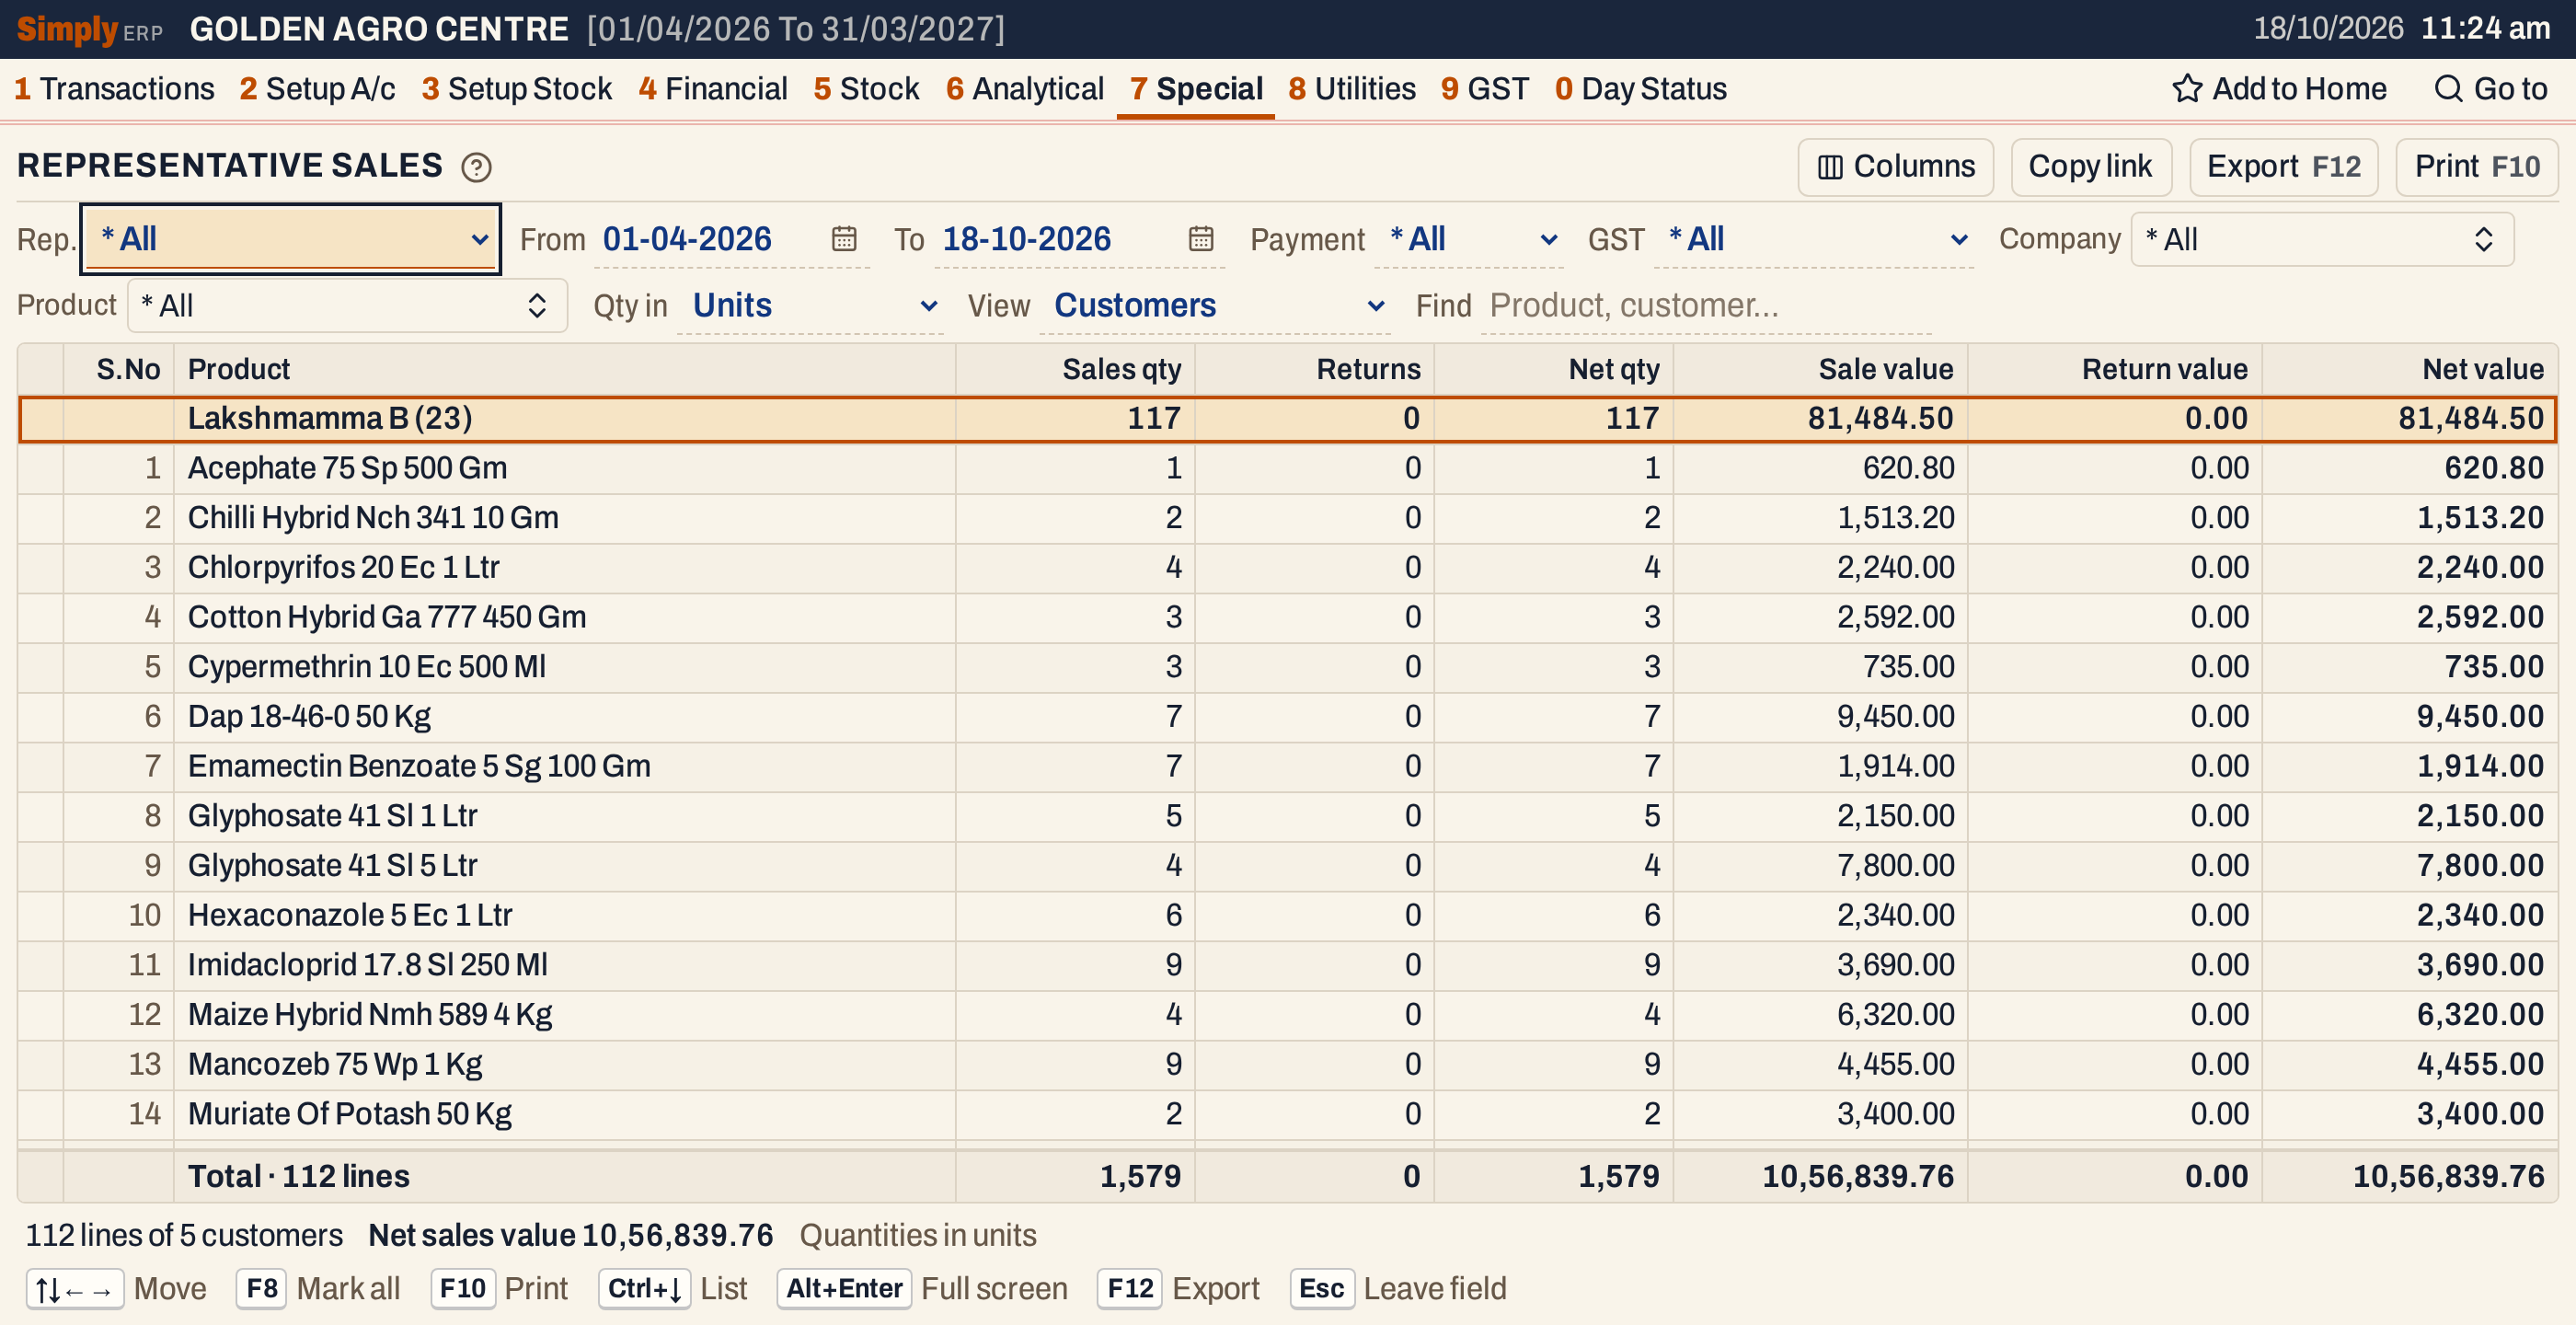 All representatives together. The customers come in name order, each with its products under its name. The heading adds up its lines.
What it lists
Sales bills and sales returns of customers who have a representative, for items that have a company. Bills with no customer account are left out.
With View on Customers, there is one line for each product a customer bought or returned in the period, adding up all its bills, under the customer’s name. The heading gives the customer’s name, its number of lines in brackets, and its figures. Customers are in name order, and the products under each in product order.
With View on Product summary, there is one line for each product, adding up the figures of all the customers of the chosen representative. With Rep. on All, it adds up every representative.
Columns
| Column | What it shows |
|---|---|
| S.No | The number of the line. Hidden by Columns. |
| Product | The product’s name. Under Customers, the customer’s name is the heading above its lines. Titled Group when Qty in is Litres / kg. |
| Sales qty | The units sold. |
| Returns | The units returned. Hidden by Columns. |
| Net qty | Sales qty less Returns. Hidden by Columns. |
| Sale value | The value of the sales. |
| Return value | The value of the returns. Hidden by Columns. |
| Net value | Sale value less Return value. |
The totals line adds up each column. The status line gives the number of lines and customers, or of products, and the net sales value.
Choices
| Choice | What it does |
|---|---|
| Rep. | * All (the default), or one representative. The list holds the representatives who have sales in the period. |
| From, To | The period. Both days are included, and both must fall in the financial year. It opens on the financial year’s first day and ends on today. |
| Payment | * All (the default), Cash or Credit bills. |
| GST | * All (the default), Registered or Unregistered: bills that record a GSTIN for the customer, or none. |
| Company | Only the products of the chosen companies. |
| Product | Only the products you choose. |
| Qty in | Units (the default) or Litres / kg, which gives each product’s quantity in litres or kilograms. |
| View | Customers (the default) lists each customer’s products. Product summary gives one line for each product. |
| Find | Shows only the lines whose product, company, customer or representative matches what you type. |
Click a column title to sort by it, and click again to reverse. Shift+click adds a second column to the sort. Every choice is kept in the page address, so Copy link gives a link that opens the same report.
 The choices above the grid.
How the figures are worked out
Each item line of a sales bill or a sales return is read, if its customer has a representative and its item has a company, and it passes the choices above.
- The date that counts is the bill’s date for a sales bill, and the received date (Recd.) for a sales return.
- Sales qty is the units on the sales bills. Returns is the units on the sales returns. Net qty is Sales qty less Returns.
- Sale value is the line’s taxable amount, after its discounts and before GST, when the bill records a GSTIN for the customer. When it records none, it is the line’s net amount, with GST. Return value is worked out the same way for the returns. Net value is Sale value less Return value. Charges at the foot of a bill are not included.
- Goods delivered and not yet billed are counted as sales for the quantity not yet billed, at the unit price quoted on them, and goods taken back and not yet billed as returns. This holds only while Payment and GST are on All.
- With Litres / kg, each product’s units are multiplied by its pack size in litres or kilograms, as the product’s pack size is now. A product with no pack size counts as zero. All the packings of one product are then one line, named by the product name, and the first column is titled Group.
- The totals are the sums of the lines.
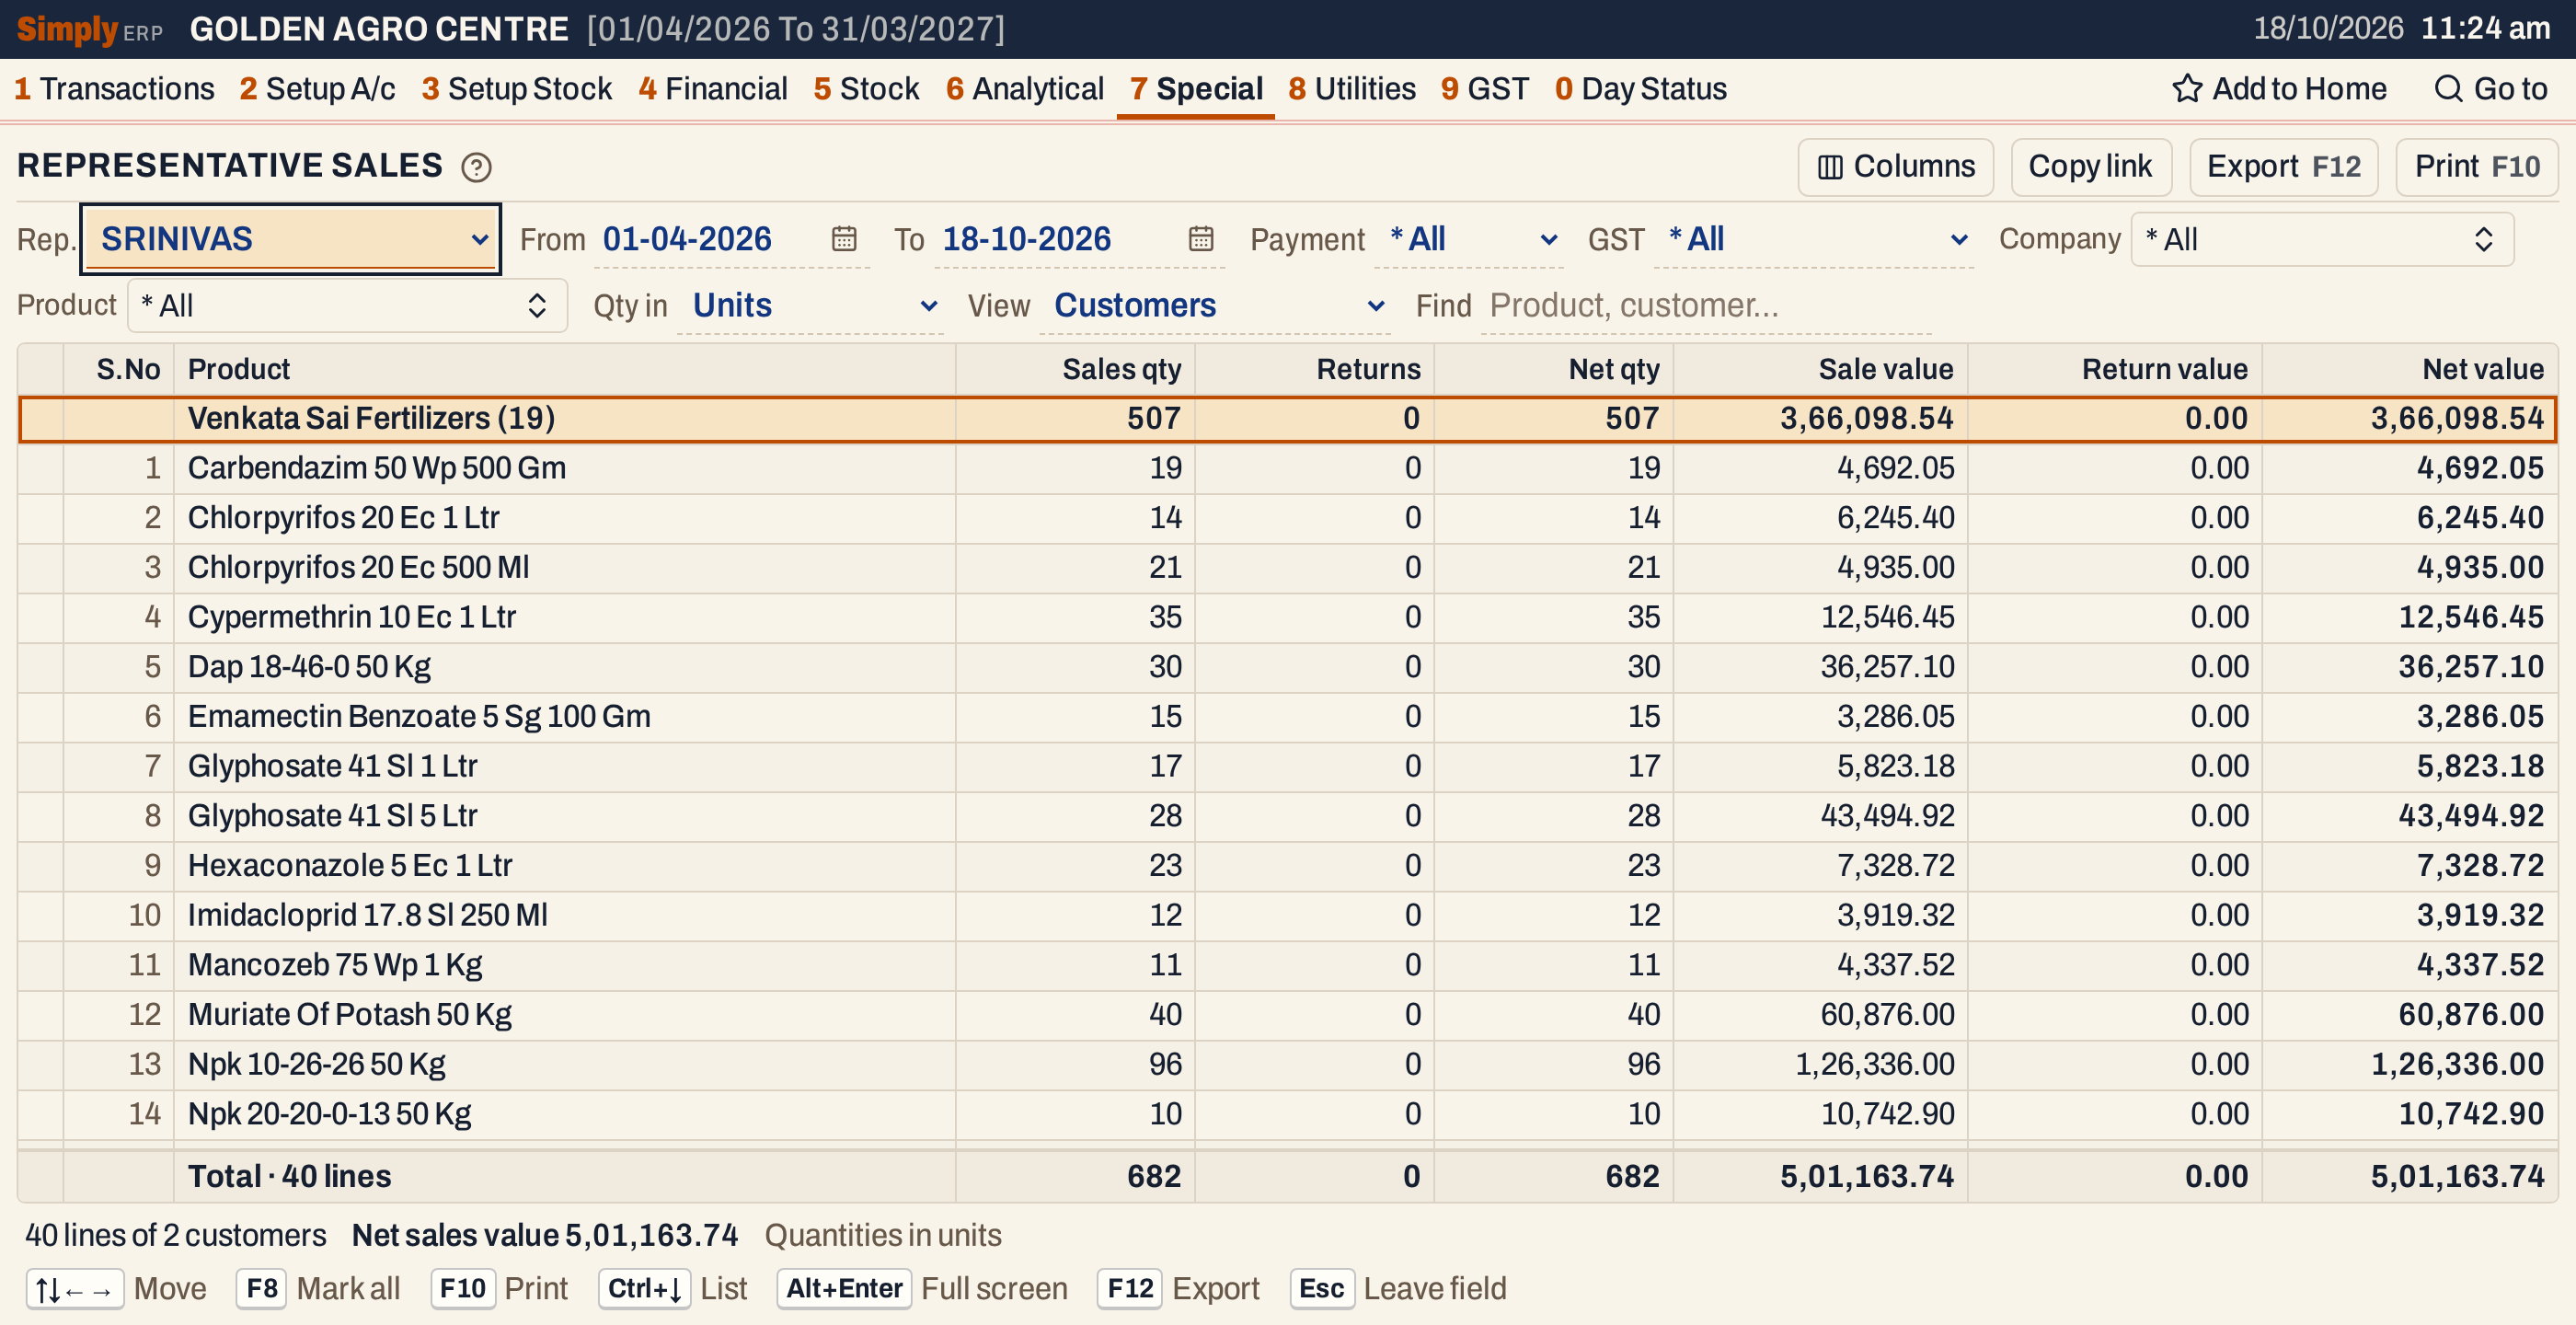 With Rep. on SRINIVAS, its customers are listed under their names. The 19 lines of Venkata Sai Fertilizers are products, each adding up all its bills.
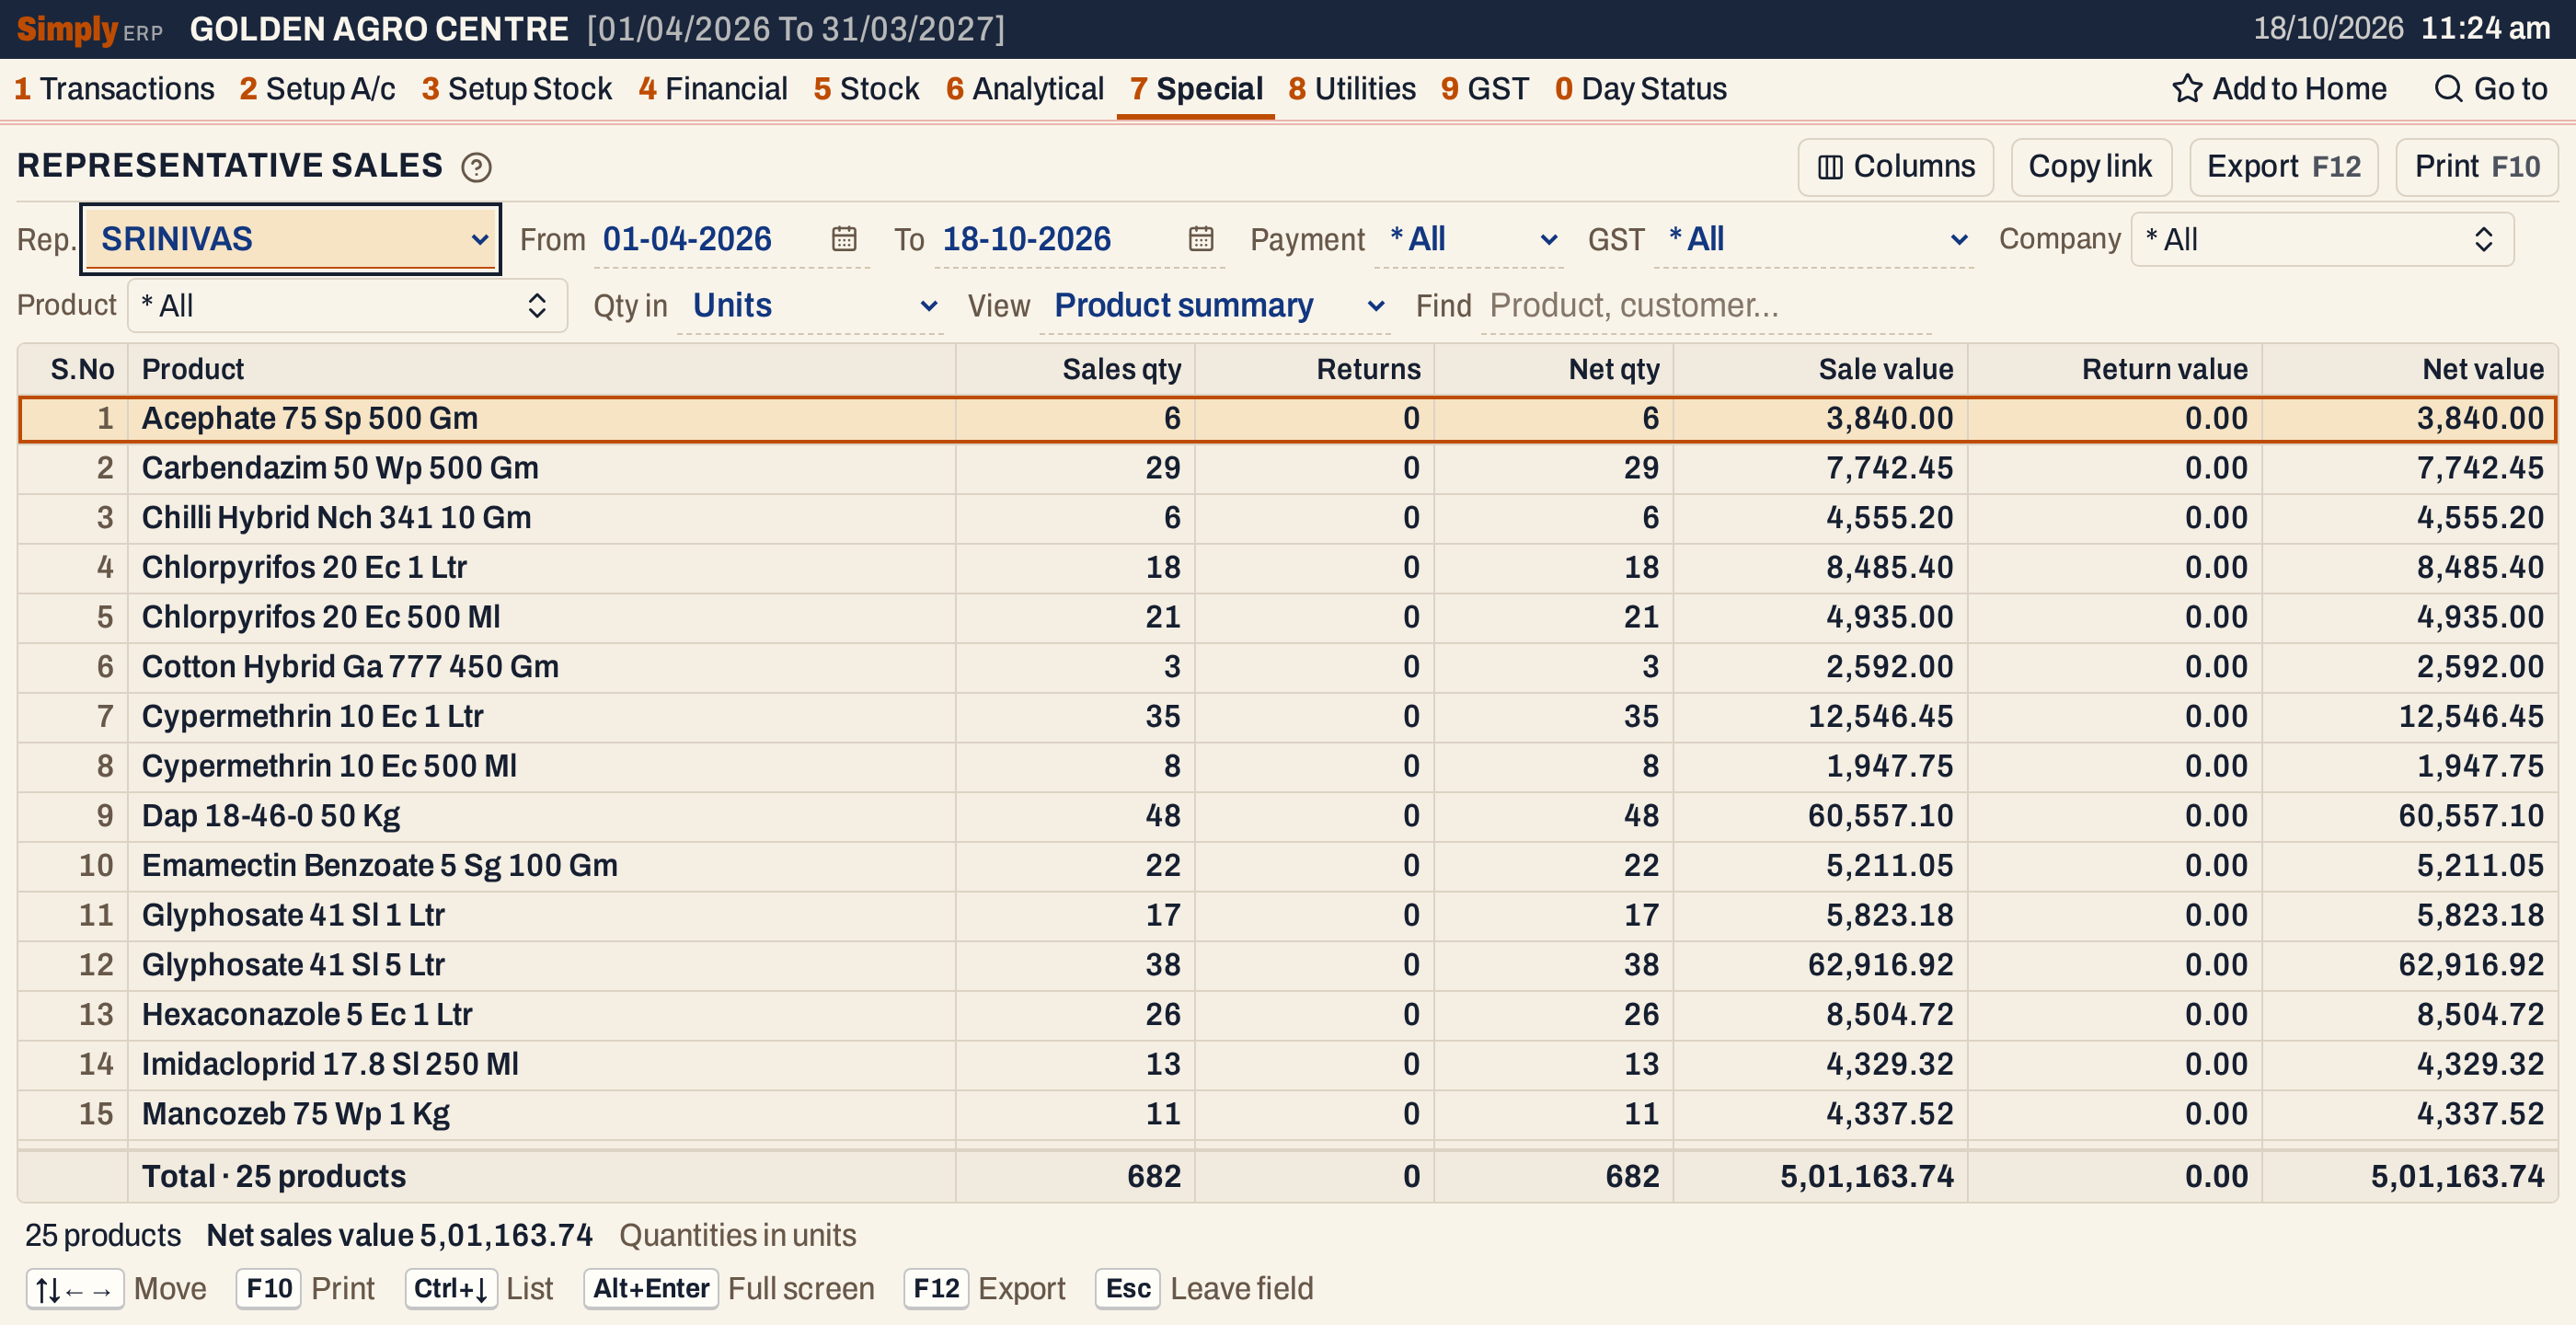 Product summary for SRINIVAS. Acephate 75 Sp 500 Gm, for example, is 6 units sold for 3,840.00 with no returns. Each product adds up its customers’ lines, and the total matches the customers’ total.
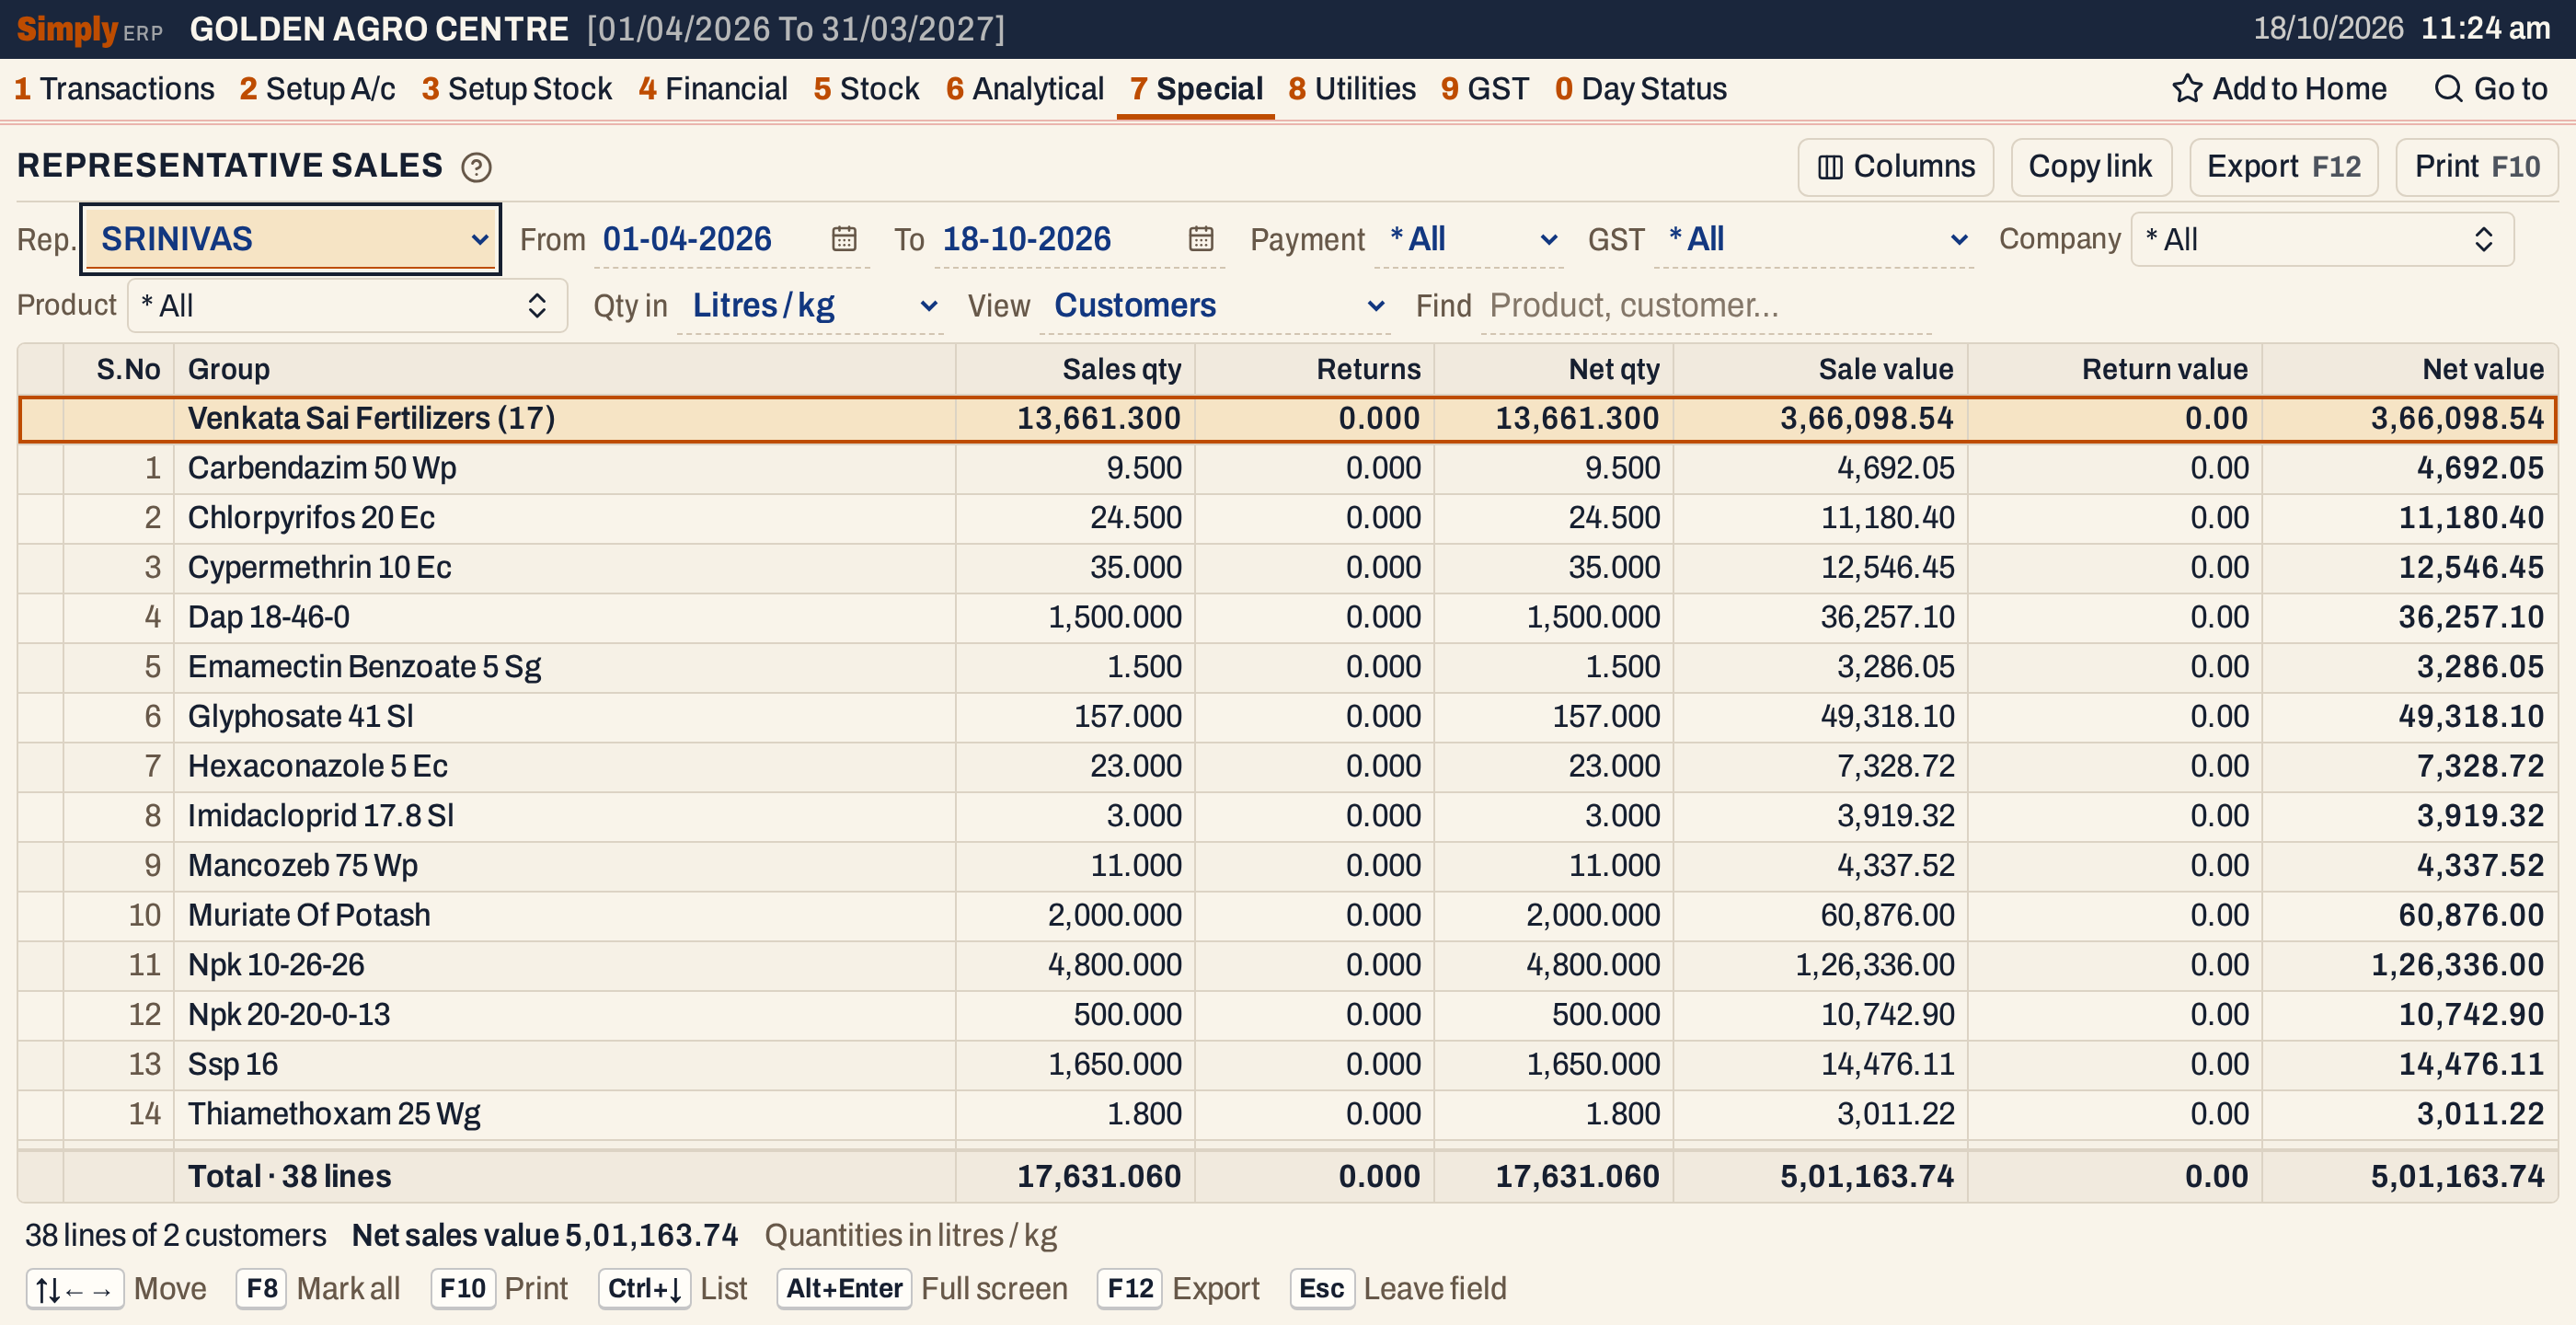 Qty in on Litres / kg. Venkata Sai Fertilizers bought 30 units of Dap 18-46-0 50 Kg, which is 1,500.000 kg here.
Open, mark, print and export
- Enter on a customer’s heading opens its Ledger for the same period. On a product line it opens the product’s Stock Ledger, except with Litres / kg. In the Product summary Enter does nothing.
- F2 marks a line and F8 marks them all. F10 then prints only the marked lines. Marking is not available in the Product summary.
- F10 prints the report with the representative, the period, the units and your choices in its heading. Columns chooses the columns shown and printed.
- F12 saves the printed report as an Excel workbook, with the figures as numbers.
- Alt+Enter gives the whole window to the list.
Updated 4 November 2026.