Monthly Receipts
On this page
The Monthly Receipts report shows how much each customer has paid you in each month, April to March. Use it to see which customers pay, when they pay, and how collections run through the season, with the customers grouped by area.
Open the report
Press Alt+7 for Special Reports, then Z for More Special Reports, then G. The menu calls it Receipts [Month Wise]; the screen’s title is Monthly Receipts. The report opens for the financial year from its first day to today, with the cursor on Group by.
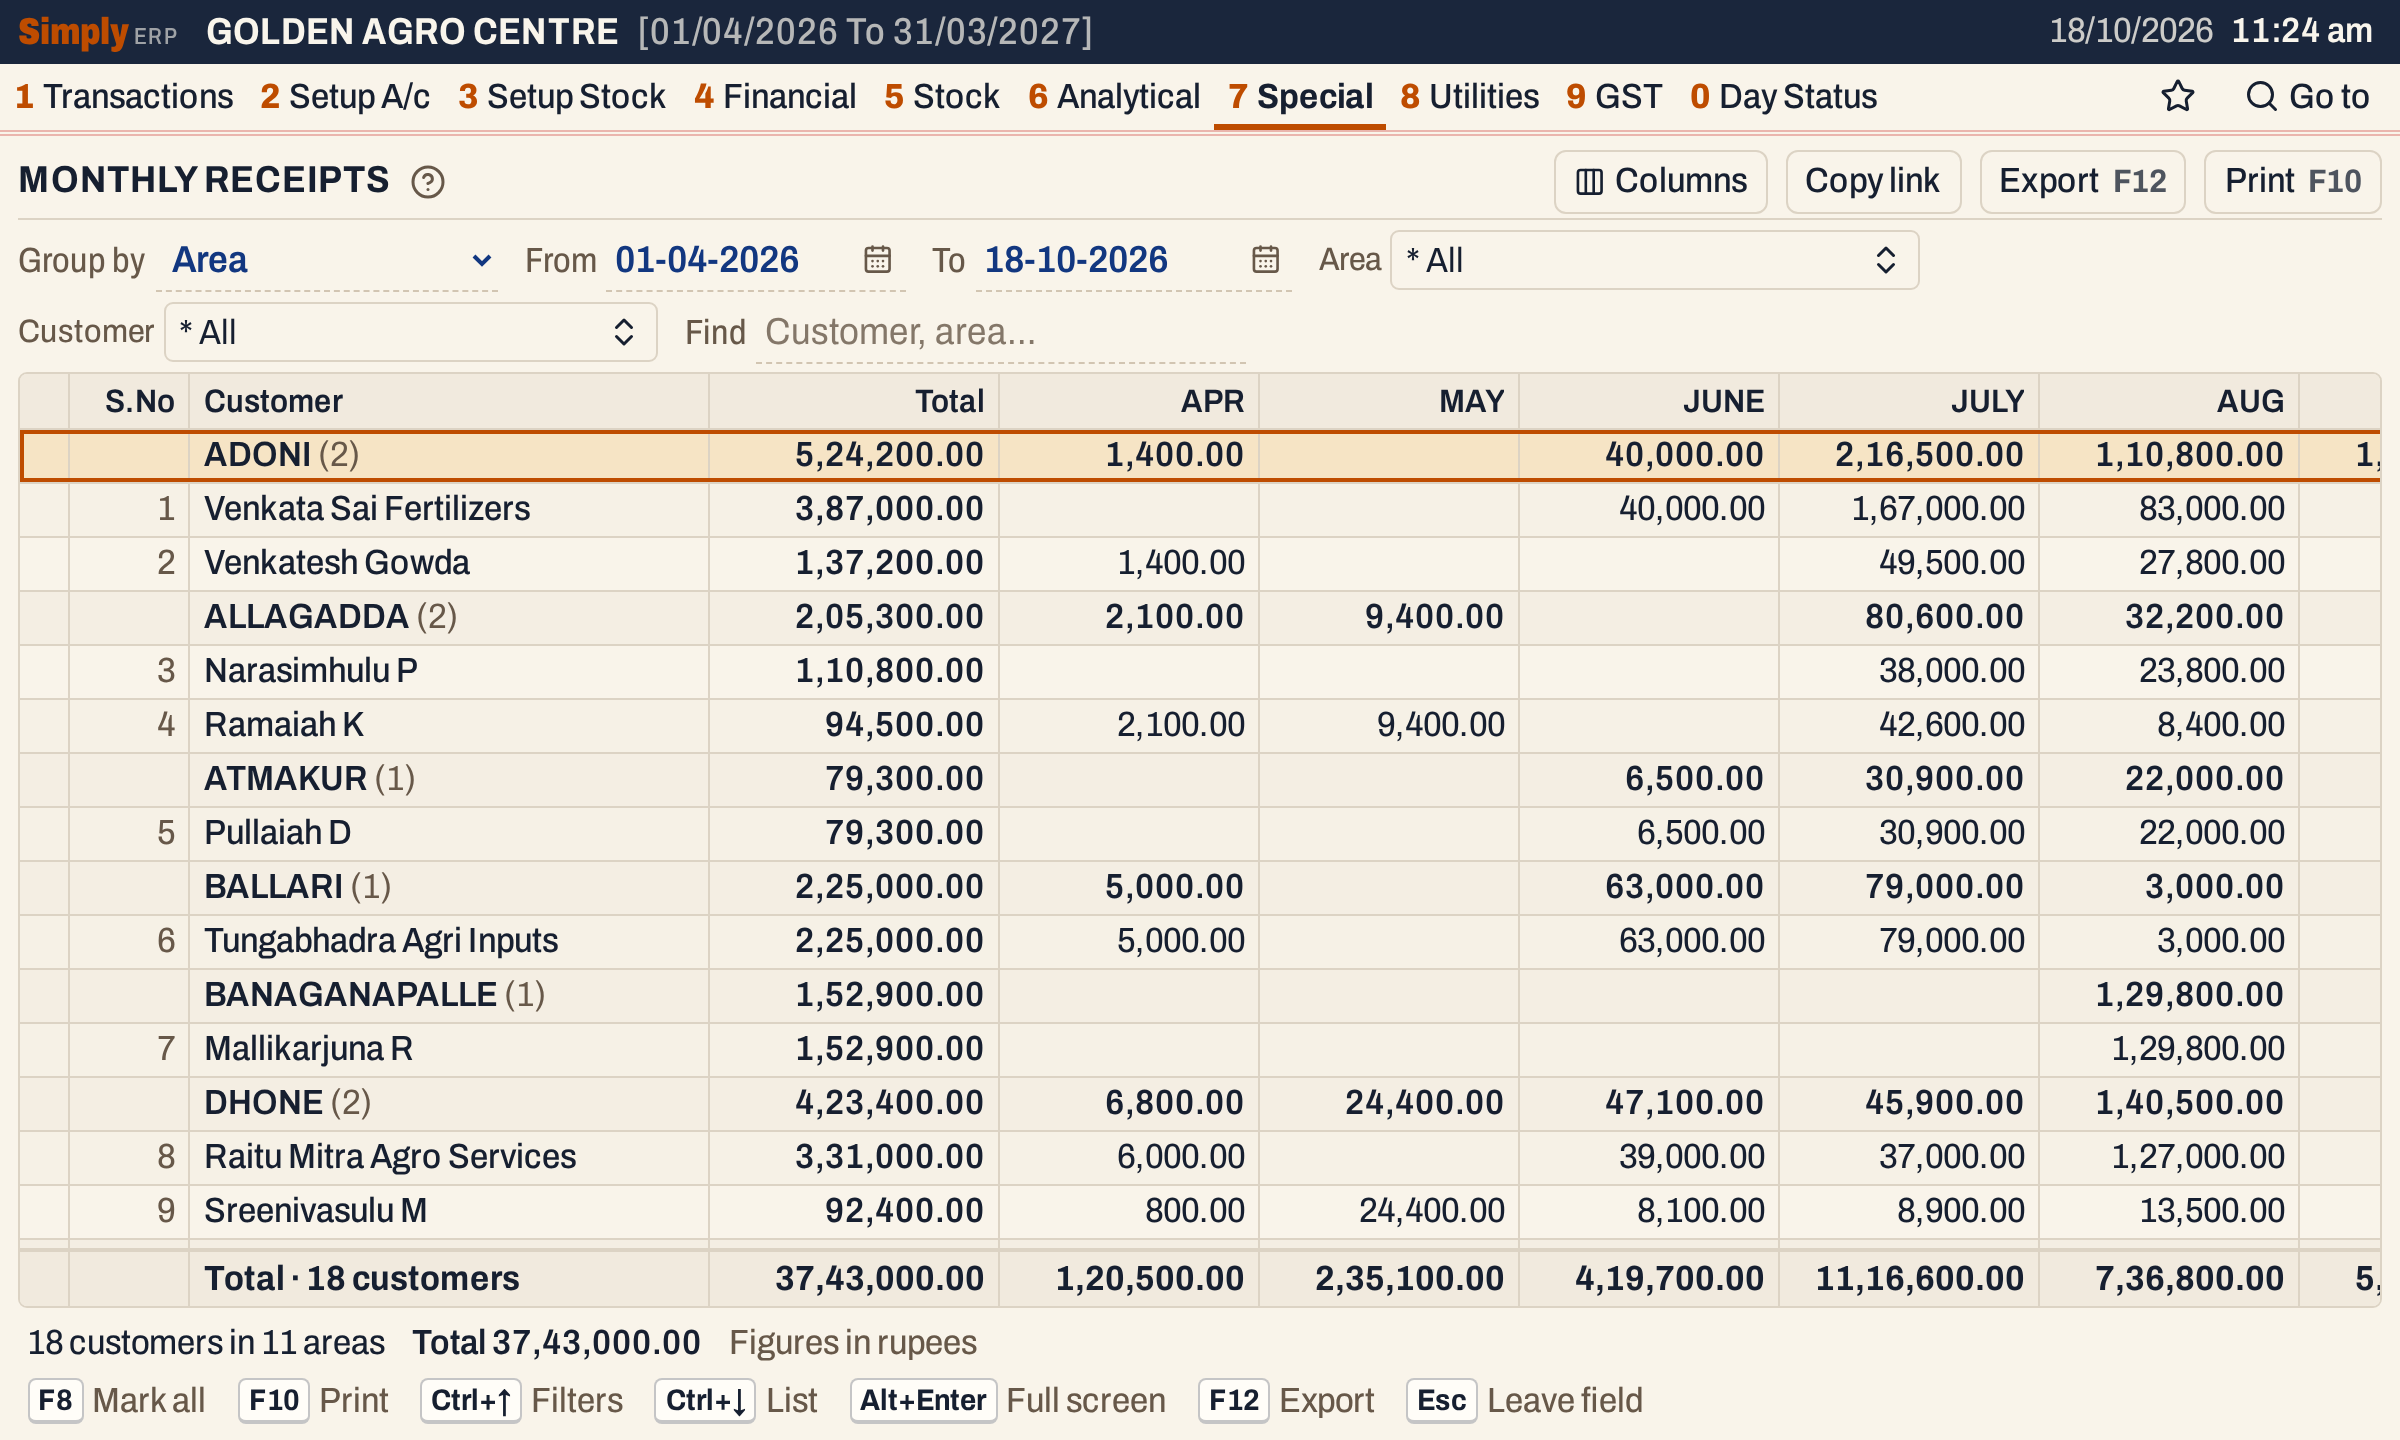 Each area is a bold line with the number of its customers in brackets; the customers come under it. Adoni has two customers and 5,24,200.00 in receipts.
What it lists
One line for each customer who has a receipt in the period, under the customer’s area. The report reads the receipt, bank and journal vouchers: it takes the credit side of each voucher line that is posted to a customer, and takes off any debit posted to the same customer. It reads:
- accounts of the type Customer, Customer - Supplier and Farmer;
- cash, bank and journal vouchers, dated from the From day to the To day, both counted (receipts and payments are cash or bank vouchers);
- only vouchers that are not credit or debit notes.
Bills, opening balances and notes are not read. A customer whose account has no place (city) is left out, because the area comes from the place. The grid has one line per customer, so a customer who paid several times in a month has one figure for that month.
Columns
| Column | What it shows |
|---|---|
| S.No | The line’s number among the customers. Hide it with Columns. |
| Customer | The customer’s name; on an area line, the area and its customer count in brackets. |
| Total | The customer’s receipts over all the months. It comes right after the name, before the months. |
| APR to MAR | The receipts of each month, April first. A month with nothing is left blank. Hide any month with Columns. |
S.No and Customer stay in view when you scroll the grid sideways. A figure below zero is shown in red with a minus sign. The totals line under the grid counts the customers and adds up every column, and the status line gives the count of customers and areas and the grand total.
On a 1200-pixel window the later months are off to the right; scroll the grid sideways to see them.
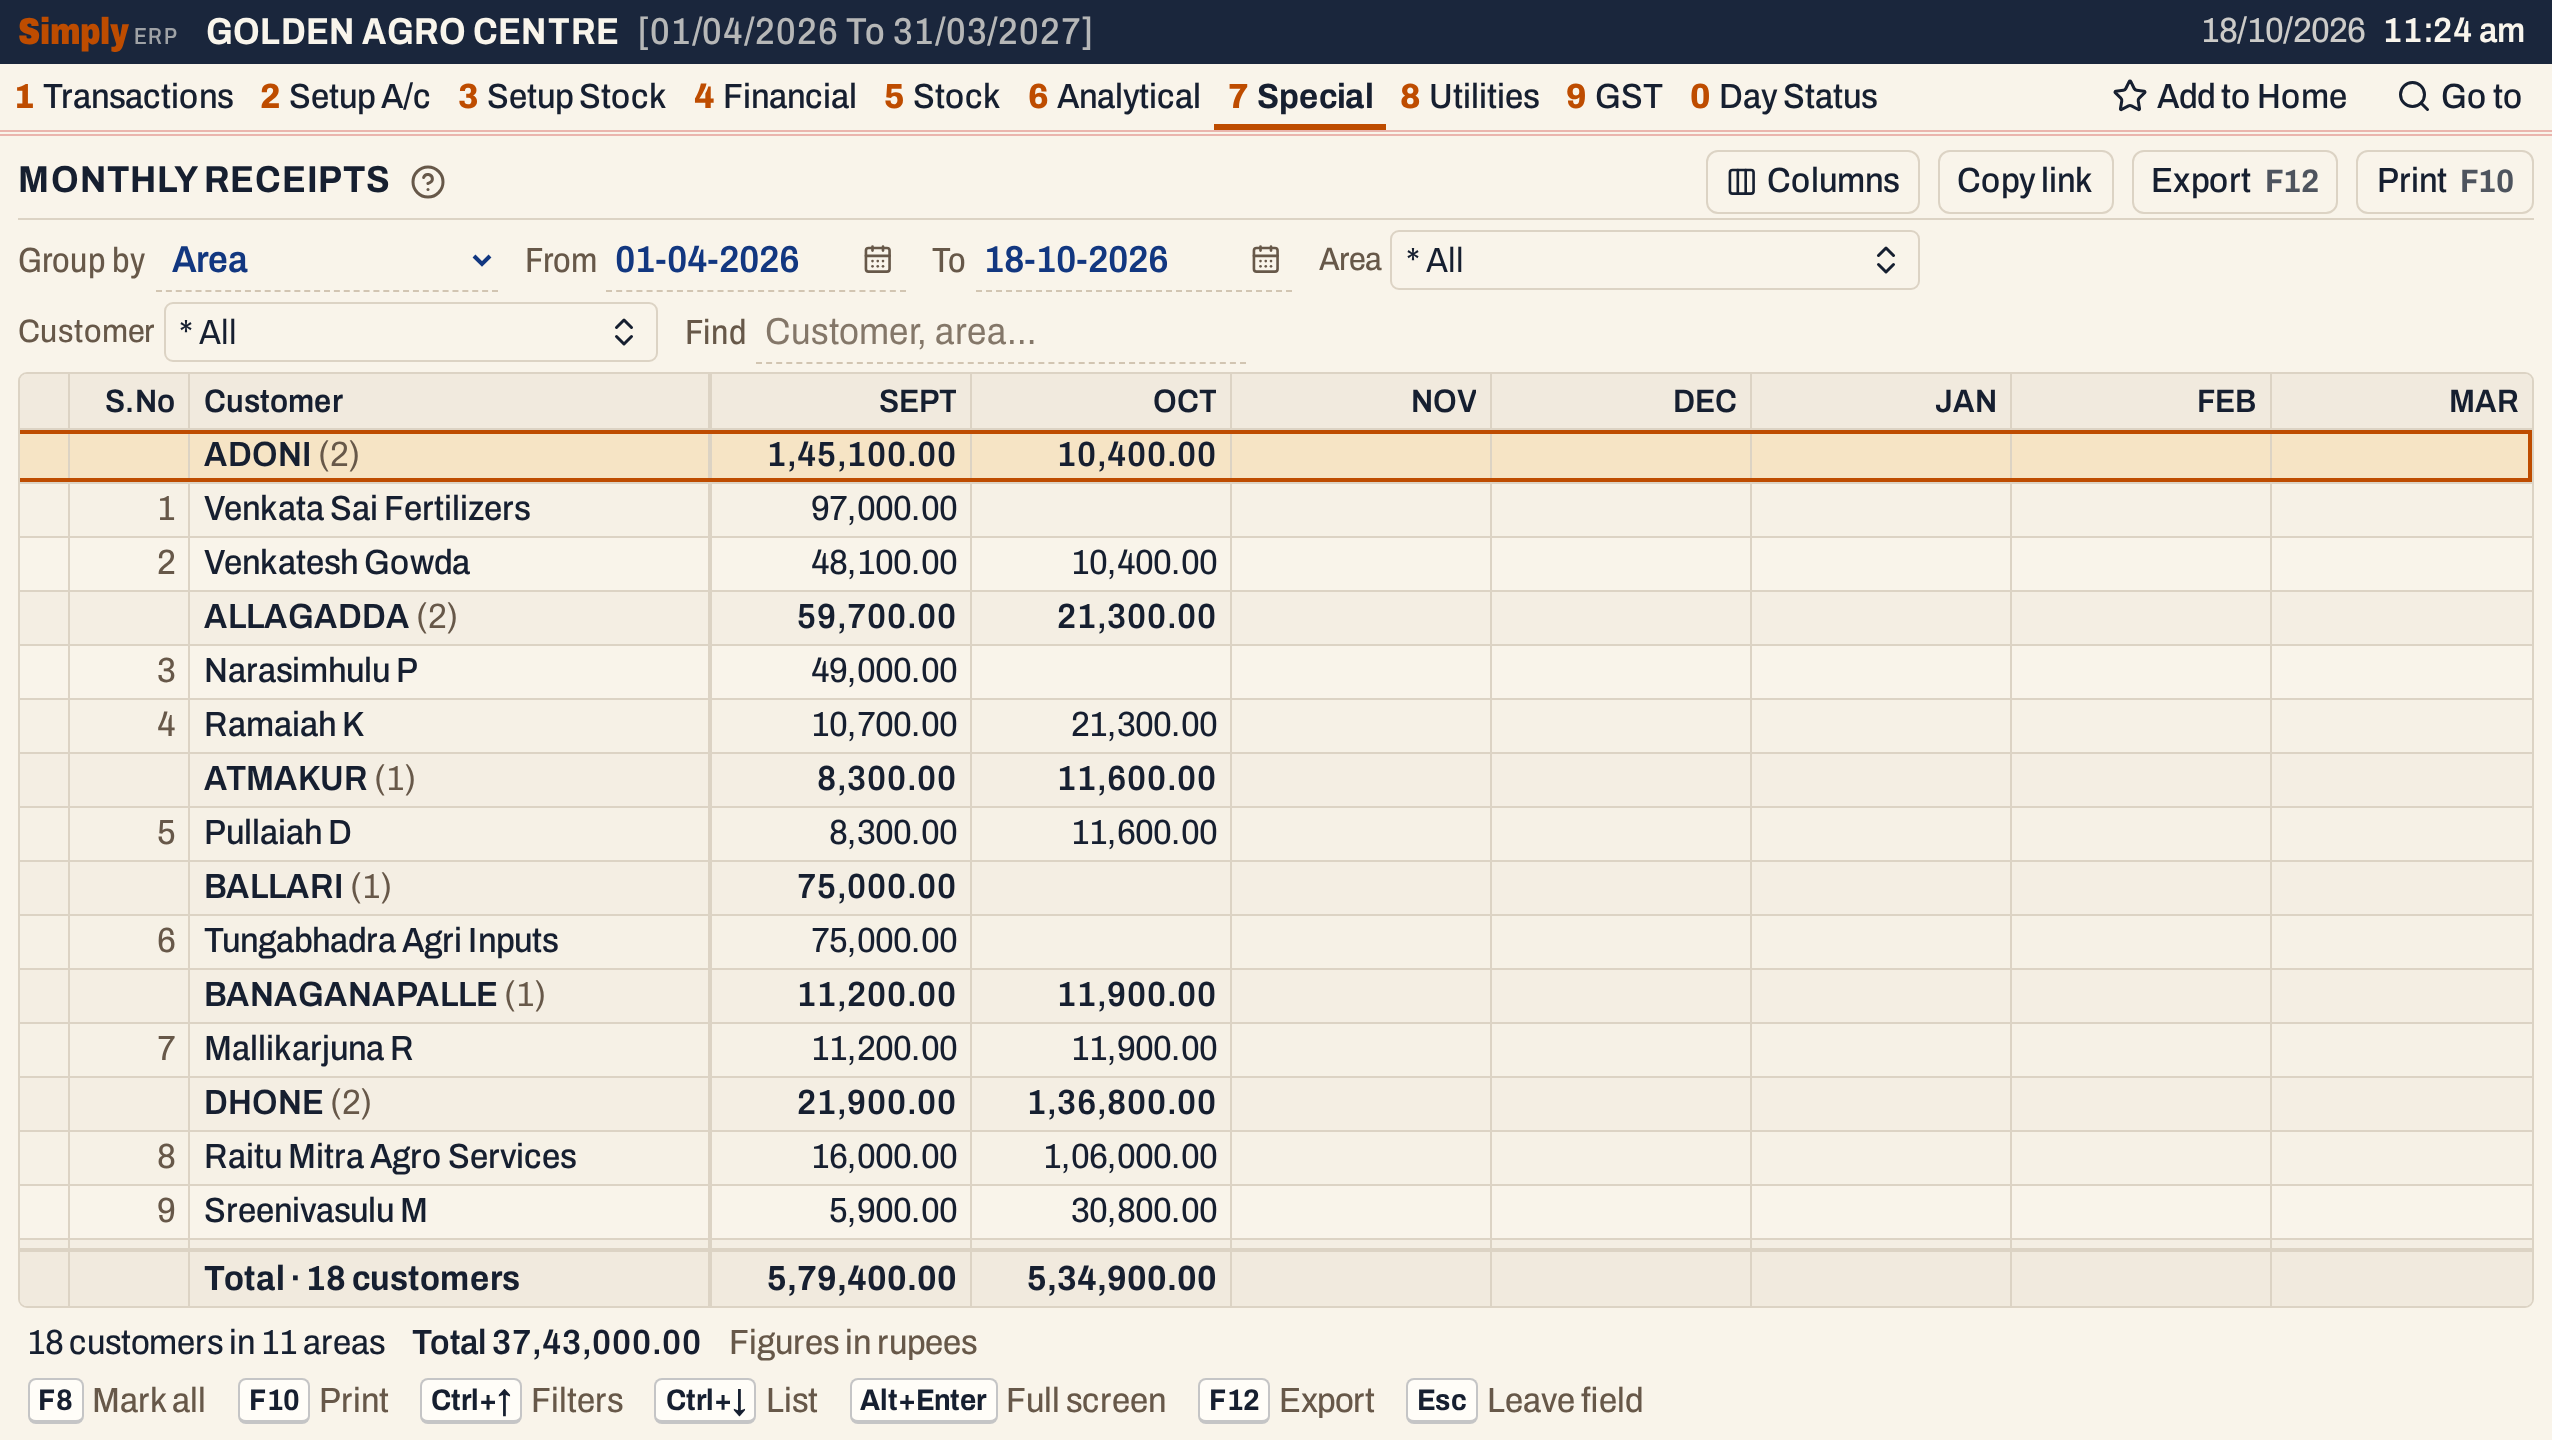 Scrolled to the right, on a window a little wider than usual. Receipts to 18 October fall in September and October; November to March are empty.
Choices
| Choice | What it does |
|---|---|
| Group by | Area (the default) groups the customers by their place. Representative lists only customers who have a representative set in Account Grouping; the lines are still headed by the Area on each customer’s account. The next box is named after this choice. |
| From, To | The period, both days included. Both dates must fall in the financial year. The default is the first day of the year to today. |
| Area / Representative | Shows only the headings you tick: the areas that head the lines. The default is * All. |
| Customer | Shows only the customers you tick. The default is * All. |
| Find | Shows only the lines whose customer name or area matches what you type. Every word you type must match. |
Click a column title to sort by it, and click it again to reverse. The first click on Total or a month puts the largest figure first, and then the areas are ordered by their figure in that column, and the customers within each area too. Sorting by Customer puts the customers of each area in name order, or the reverse; the areas stay in name order. Every choice is kept in the page address, so Copy link gives a link that opens the same report.
 The choices of the report as it opens.
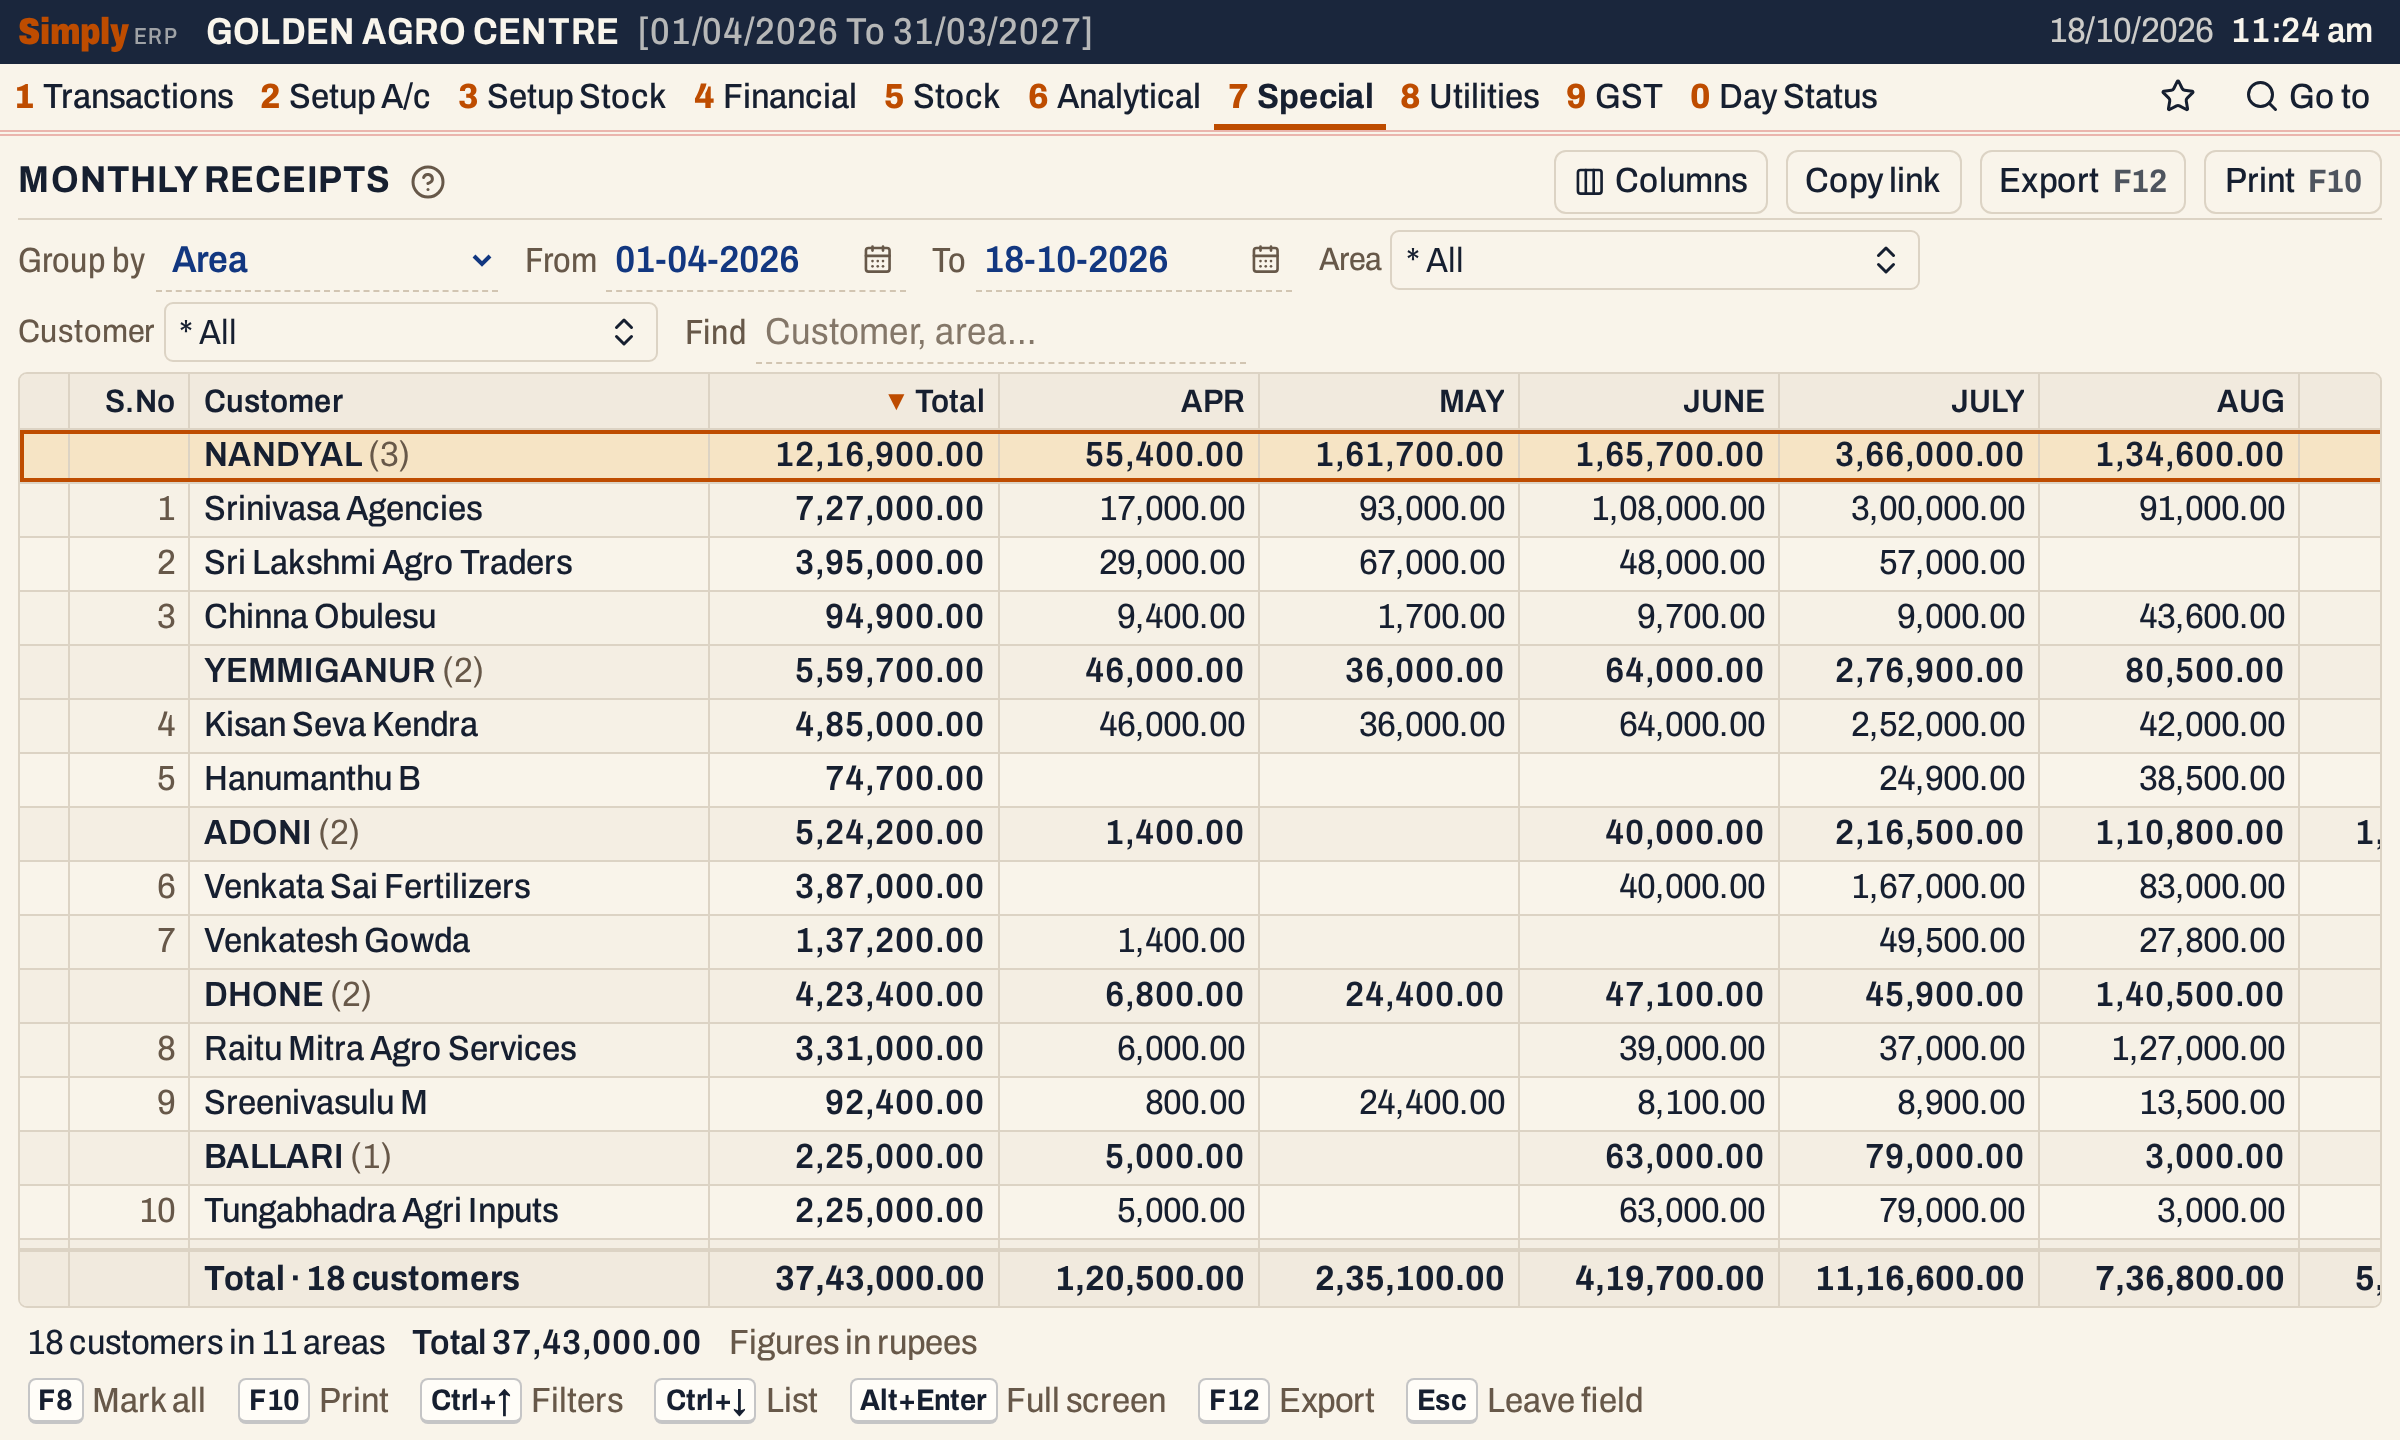 Sorted by Total. The arrow on the title shows the column; Nandyal collects the most.
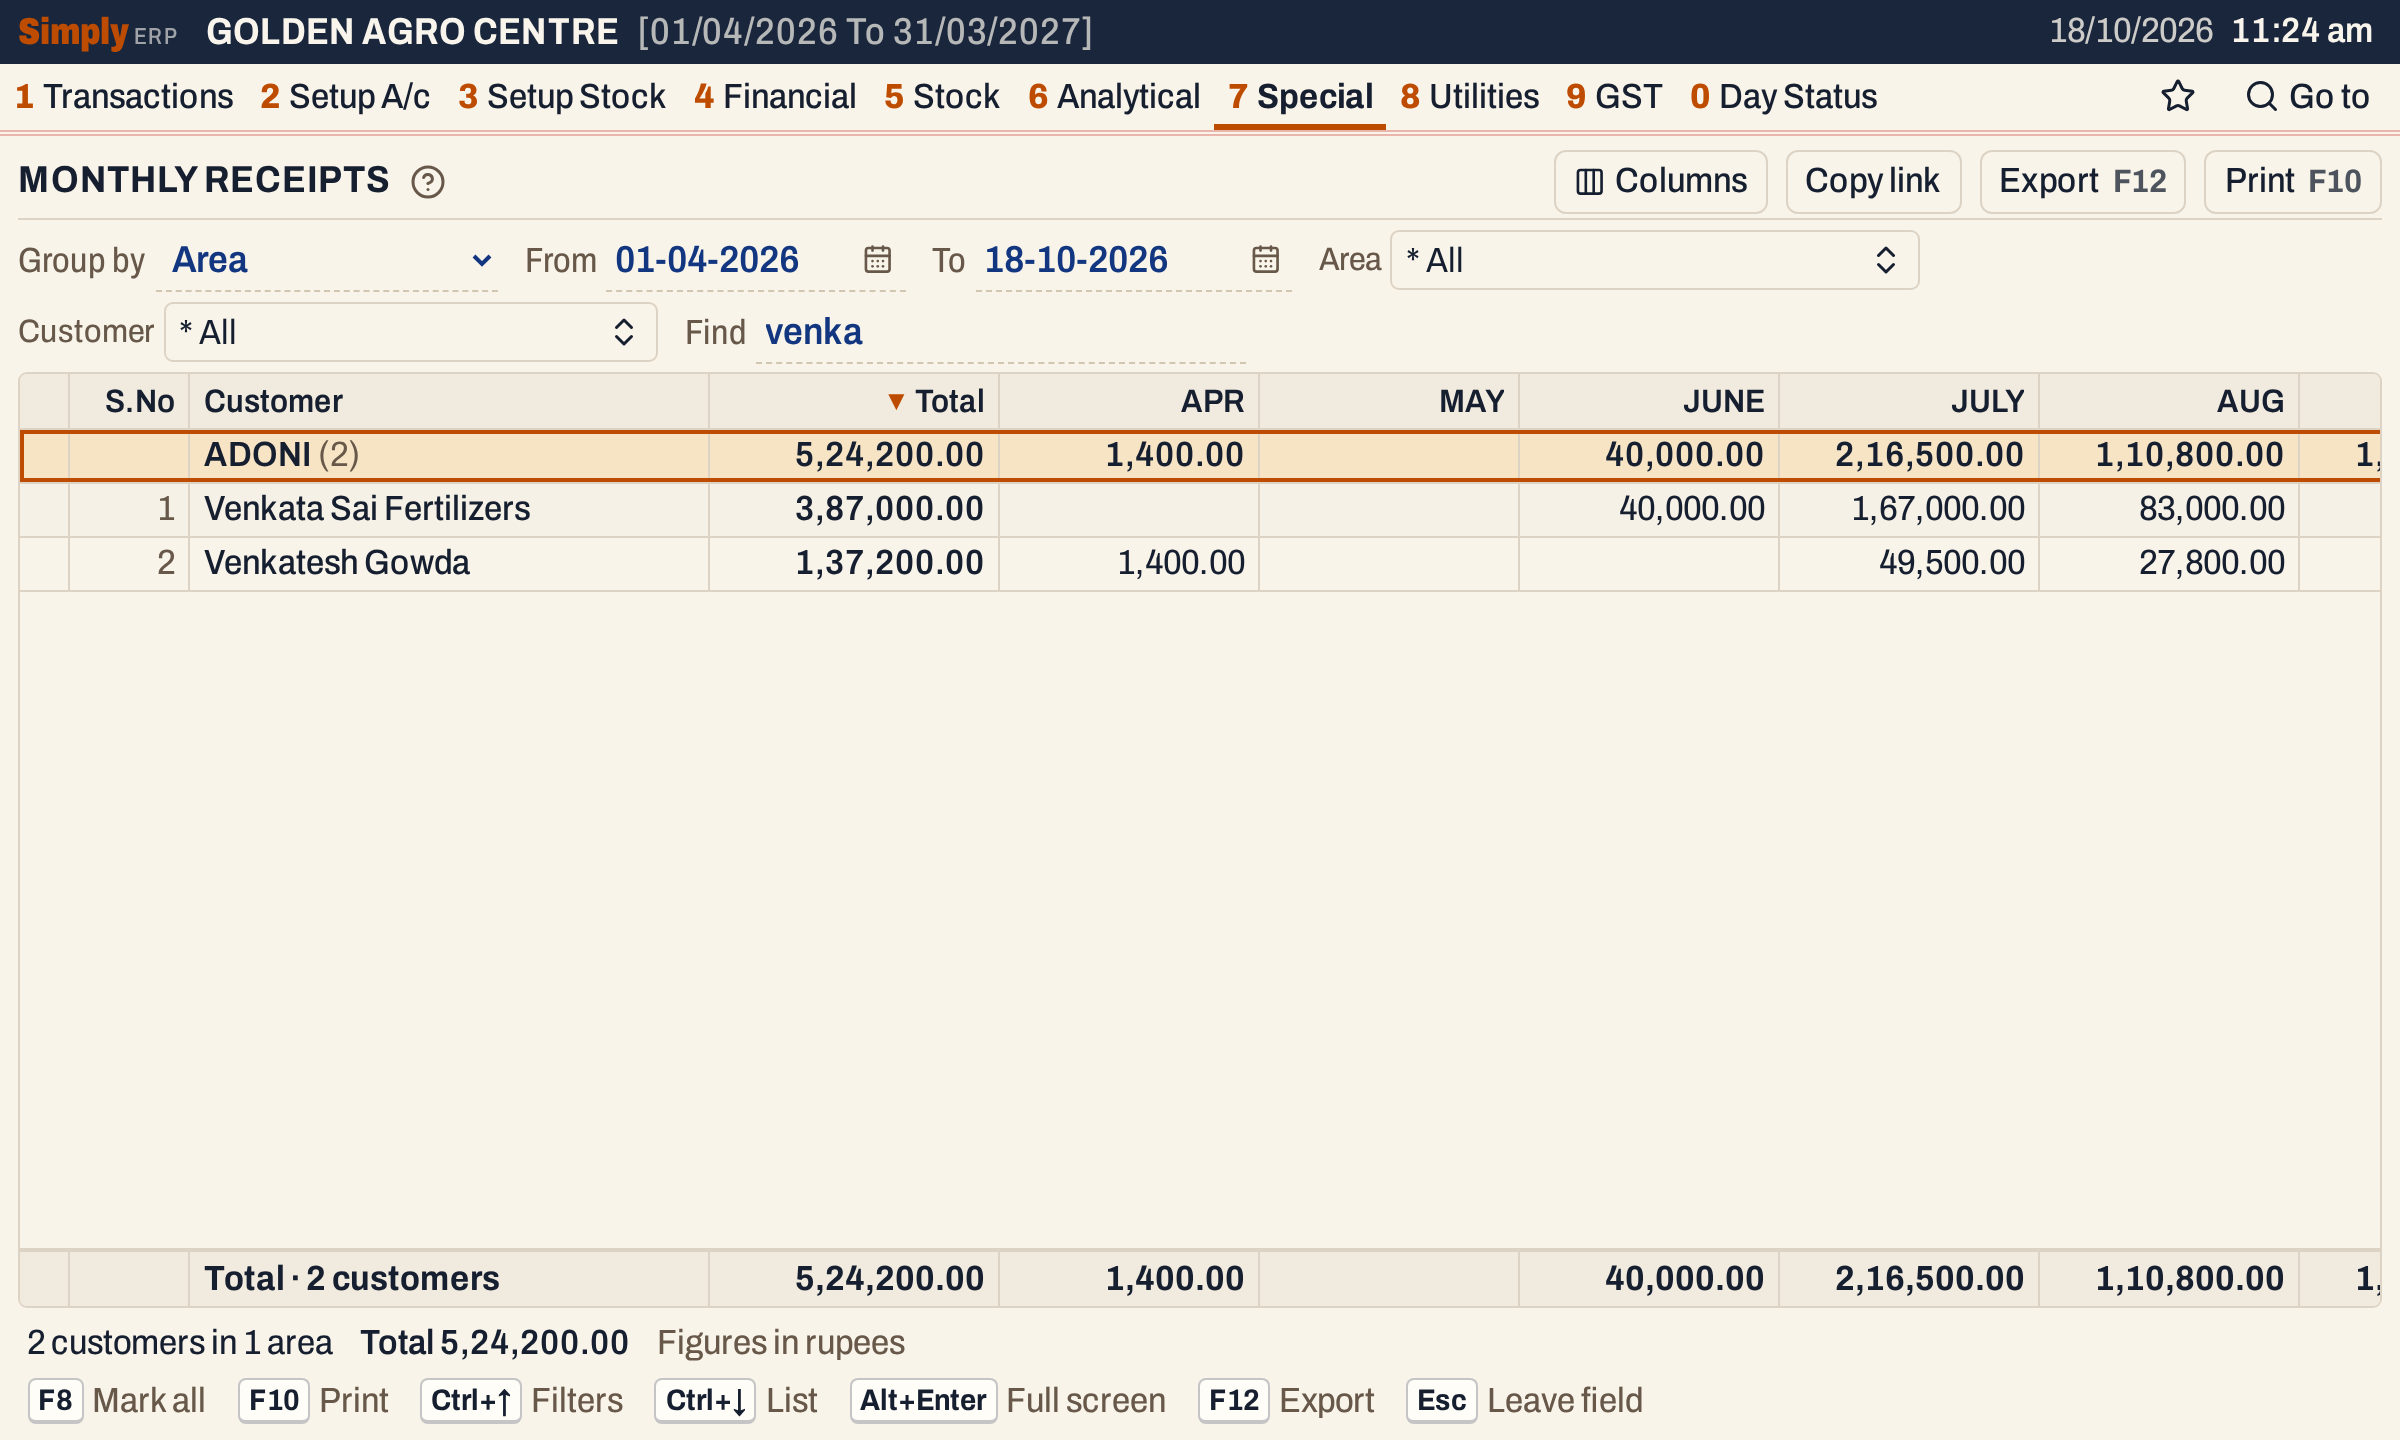 Find narrows the lines and the totals line to the customers that match.
How the figures are worked out
For each customer and each month, SimplyERP adds up the voucher lines posted to the customer’s account: credits less debits, by the date of the voucher. A voucher counts in the month it is dated, and the months run April to March whatever the period you choose.
- Month figure = credits − debits on the customer’s lines in Cash, Bank and JV vouchers dated in that month and inside the period.
- Total = the sum of the month figures. A month you hide with Columns is still in the Total.
- Area line = the sum of its customers’ lines.
- Totals line = the sum of all the customers.
A journal voucher that credits a customer counts as a receipt, as a cash receipt does. A payment you make to a customer is a debit and is taken off. The figures are rounded to the paisa.
 The totals line adds up the customers shown; the status line repeats the count and the grand total.
Open, mark, print and export
- Enter on a customer opens the Ledger of the customer for the same period. Back returns to the list. Enter on an area line shows only that area.
- F2 marks a customer and F8 marks every customer on the screen. When any are marked, F10 prints only those, and the print says Marked rows only.
- F10 prints the report as it is on the screen, under the title MONTH WISE RECEIPTS. Its heading gives the period and your choices, with a line saying how it is grouped. The first column is Name of the Customer, the Total Amount comes right after it, before the months, and the print leaves out the months you hid.
- F12 saves it as an Excel workbook.
- Alt+Enter gives the whole window to the list.
Updated 4 November 2026.