Customer vs Product Group Sales
On this page
The Customer vs Product Group Sales report shows, for each customer, how much of each product group it bought in the period, and what those groups came to in money. Customers are listed under their areas, one column per product group, so you can see at a glance which customers buy which groups.
Open the report
Press Alt+7 for Special Reports, then H. The report opens for the financial year from its first day to today, with Report on Customer wise, Parties on Both and every manufacturer, group and area chosen.
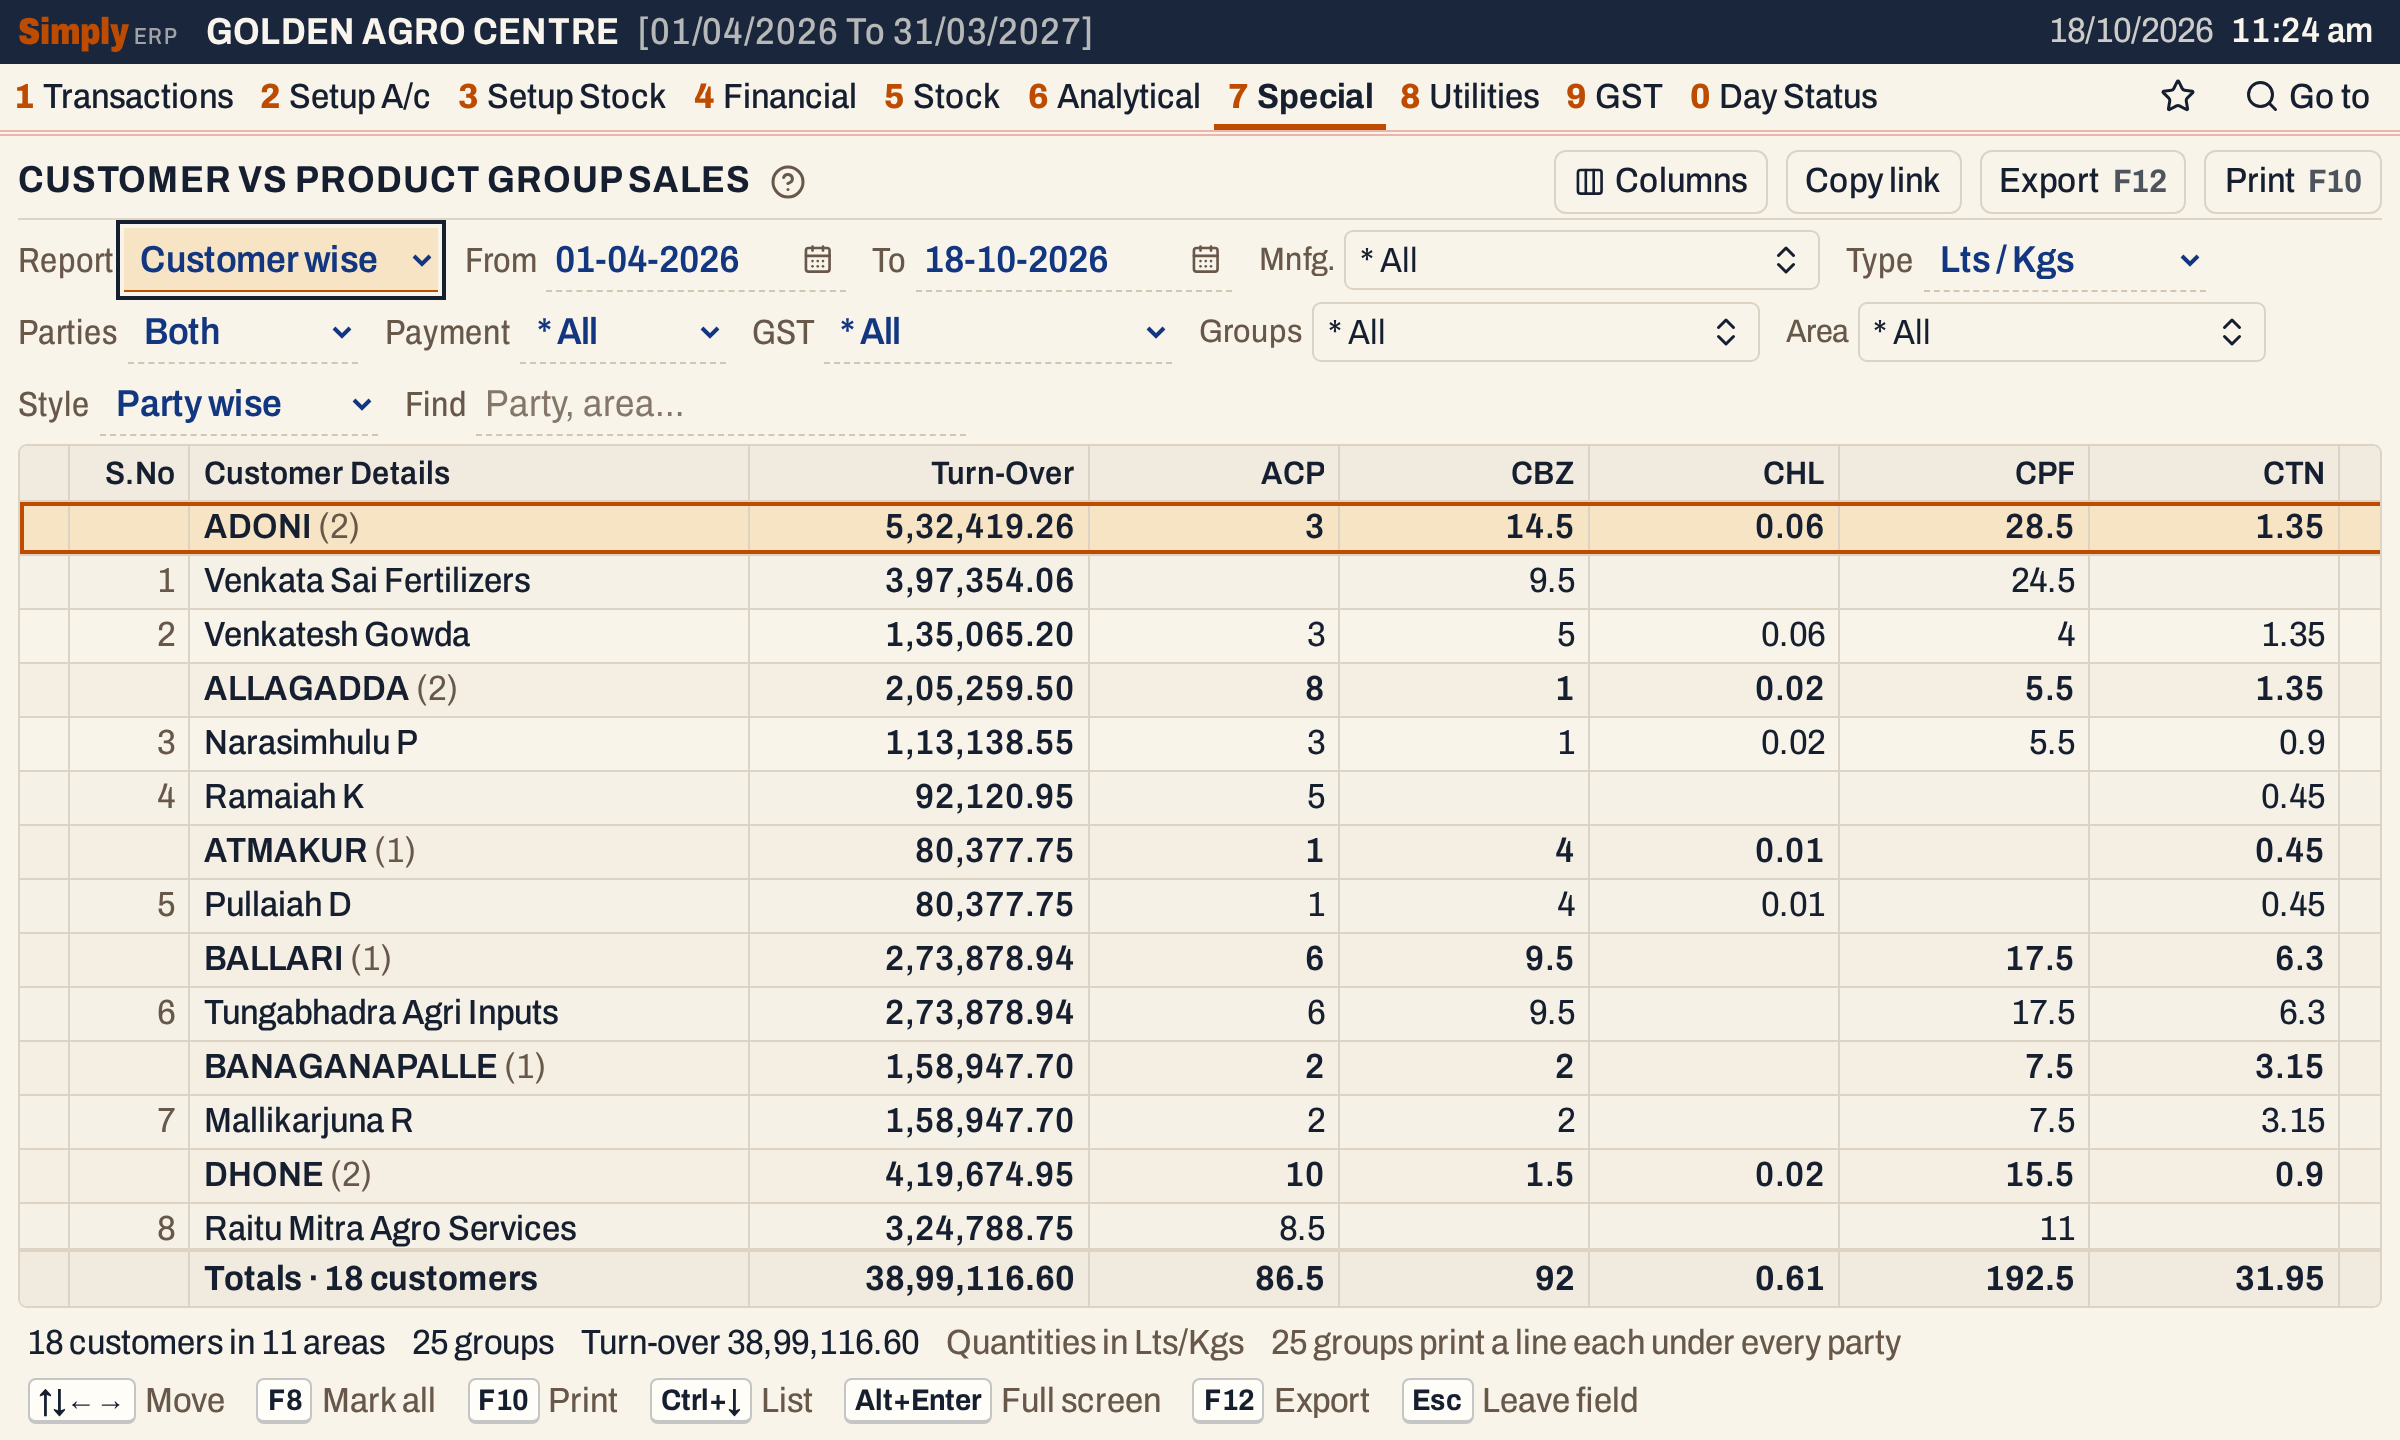 Each area is a bold line with its customers under it. Each group column shows the net quantity in Lts / Kgs. The books have 25 groups; the window shows the first five, and the status line counts them all.
What it lists
One line for each customer who has a line in one of the groups in the period. A customer’s line is under the area on its account, the city or town.
- Sales bills add to the quantity and to the turnover.
- Sales returns are taken off.
- Purchase bills from the same customer are taken off as well. A purchase return is not counted.
- Goods on a delivery challan that no bill has taken yet (Goods In / Out, Pending DC List) count too: goods sent to the customer as sales, goods sent back by the customer as sales returns and goods received from the customer as purchases. Choosing Payment or GST leaves out the unbilled sales and returns.
- Only accounts of type Customer, Customer - Supplier and Farmer are listed. A cash sale with no account is left out: a line needs an account to sit under.
- Only items that have a manufacturer count in the quantities.
A group has a column when some customer has a line in it, even if the net quantity is nil. The status line counts the customers, the areas and the groups, and repeats the turn-over total.
Columns
| Column | What it shows |
|---|---|
| S.No | The number of the customer in the list. Hidden by Columns. |
| Customer Details | The customer’s name. Each area is a heading above its customers, with their number in brackets. In Area wise style the column is called Area Name and lists the areas. |
| Turn-Over | The customer’s turnover in the groups shown, with GST. Hidden by Columns. |
| One column per group | The net quantity of the group, under the group’s code (ACP, CBZ, CHL and so on), or its name when it has no code, in the order of the group names. A blank cell means no quantity. |
The totals line adds up each column. The Turn-Over total is the total of the customers listed. Areas come in name order, with customers who have no city under * No area last, and customers in name order inside each area. Click a column title to sort the customers inside each area; a figure column also puts the areas in the order of their totals.
Choices
| Choice | What it does |
|---|---|
| Report | Customer wise (the default): customers and their sales. Supplier wise turns the report into Supplier vs Product Group Purchases, with suppliers and their purchases, and takes away Parties, Payment and GST. This page explains the Customer wise report. |
| From, To | The period. Both days are included. It opens as the financial year’s first day to today. A bill counts on its posting date: a sales bill on its own date, a sales return or purchase on the day it was received. |
| Mnfg. | Only the items of the chosen manufacturers count in the quantities. Turn-Over counts every item of the groups shown, whatever its manufacturer. |
| Type | Lts / Kgs (the default) adds up each item’s quantity in litres or kilograms. Units / Pcs adds up the units as the bills record them. |
| Parties | Both (the default): accounts of type Customer, Customer - Supplier and Farmer. Customers: Customer and Customer - Supplier. Farmers: Farmer. |
| Payment, GST | Payment: * All (the default), Cash or Credit bills. GST: * All (the default), Registered or Unregistered customers, those with and without a GSTIN. They apply to sales bills and sales returns, not to purchases. |
| Groups | The product groups to show. * All is the default. |
| Area | Only the customers of the chosen areas. * All is the default. |
| Sales man | Shown only when some customer has a Representative on its account. It keeps the customers of the chosen representatives. |
| Style | Party wise (the default) lists each customer under its area. Area wise gives one line per area. |
| Find | Shows the customers or areas that match what you type. |
 The choices above the grid. Type sets the unit of every group column.
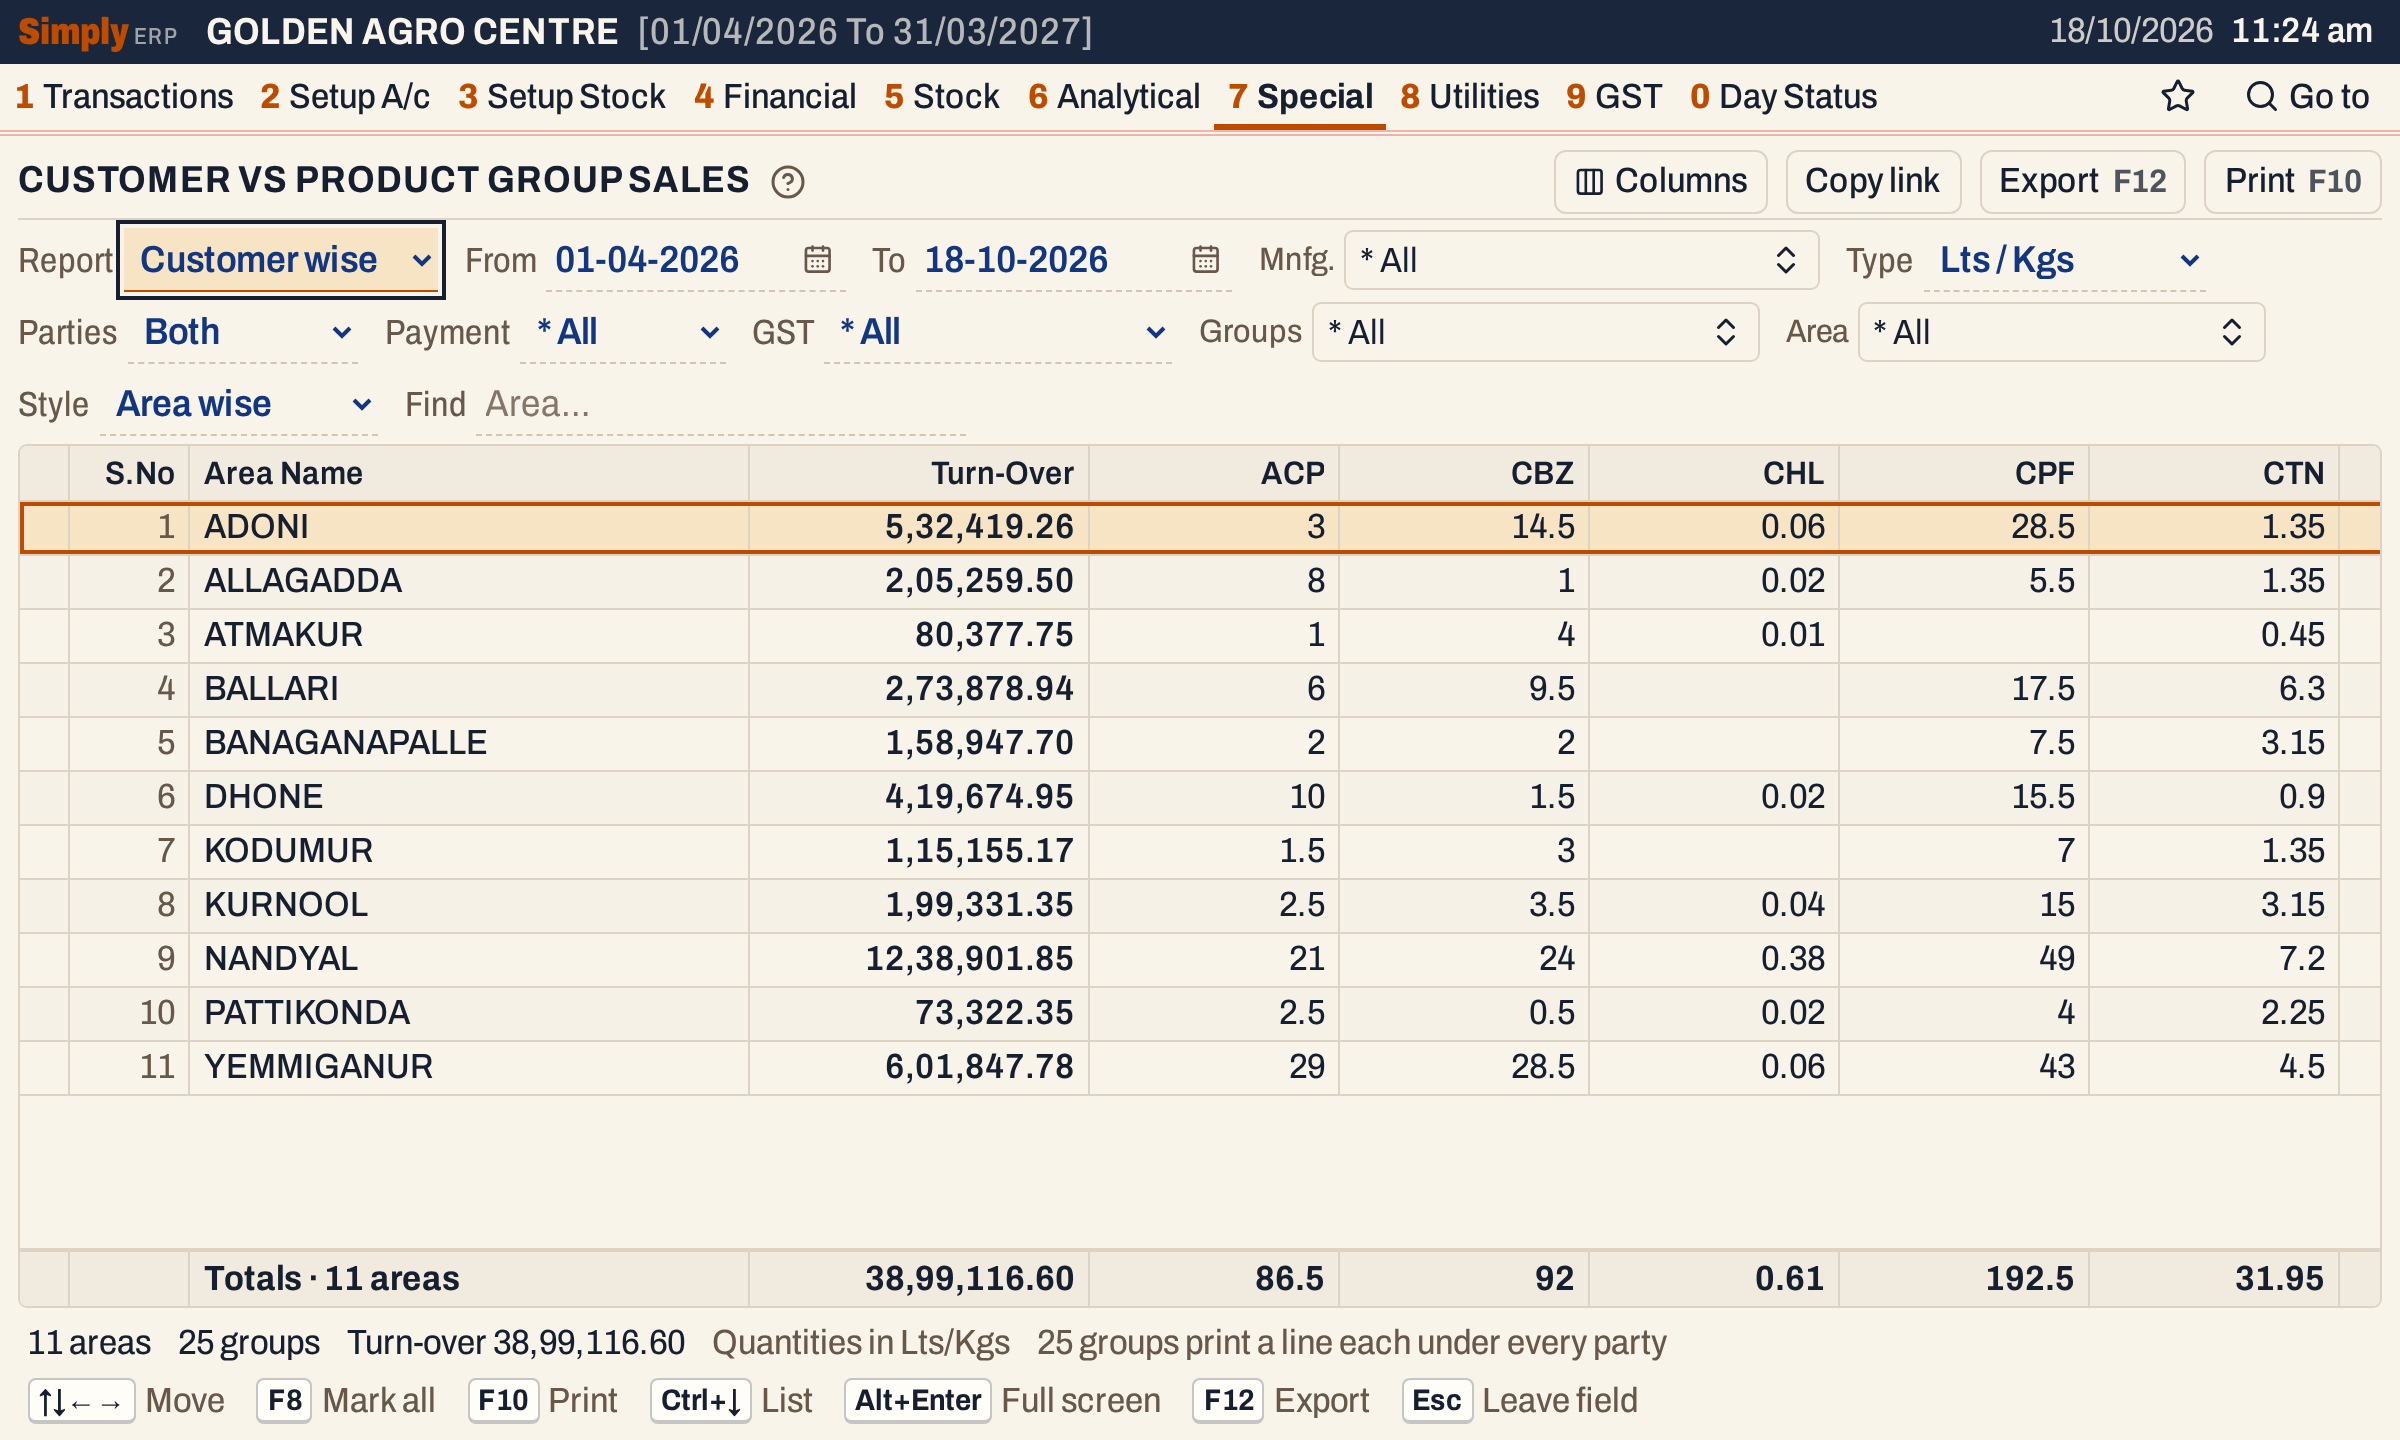 Area wise gives one line for each area. Its figures are the sums of the customers under it.
How the figures are worked out
For each customer and each product group:
- Net quantity = the quantity of the group’s items sold in the period, less the quantity returned on sales returns, less the quantity bought from the same customer.
- Lts / Kgs = each item’s quantity multiplied by the size of its packing in litres or kilograms (set in Packings). An item whose packing has no size adds nothing. Units / Pcs = the quantity as the bills record it.
- Turn-Over = the net amount of the customer’s bills for every item of the groups shown, with GST, less the net amount of its sales returns and of its purchases. A line’s net amount is the amount saved on the bill. An unbilled challan counts at the price recorded on it, and a challan with no price counts nothing.
- Quantities are shown to three decimal places at most, and money to two decimal places with Indian grouping (38,99,116.60).
Area wise adds up the customers in each area. A customer’s area is the city on its account, not the place on the bill. A customer with no city is listed under * No area, after the named areas.
The totals line is the sum of the column. A customer’s turnover is one figure for all the groups shown, so it is counted once however many groups the customer bought.
 The total of the Turn-Over column.
Open, mark, print and export
- Enter on a customer opens its Customer vs Product Sales report for the same period, which is a separate screen. In Area wise style, Enter on an area opens its customers in Party wise style.
- F2 marks a line and F8 marks them all. F10 then prints only the marked lines.
- F10 prints the report with the period and your choices. With eight groups or fewer, each group is a column. With more than eight, as in these books, the print gives a line for each group under each customer, with its quantity and the customer’s Turn-Over.
- F12 saves the printed report as an Excel workbook, with the figures as numbers.
- Alt+Enter gives the whole window to the list.
Updated 4 November 2026.