Sales Analysis
On this page
The Sales Analysis report shows what you sold of each product in a period: the HSN code, the units, the net amount and the average price. Use it to see which products sell the most units and bring in the most money, and what was sold to customers with and without a GSTIN. The net amount is before GST for customers with a GSTIN and includes GST for the others, as described under How the figures are worked out.
Open the report
Press Alt+6 for Analytical Reports, then B. The report opens for the financial year from its first day to today, with one line for each product, in product name order.
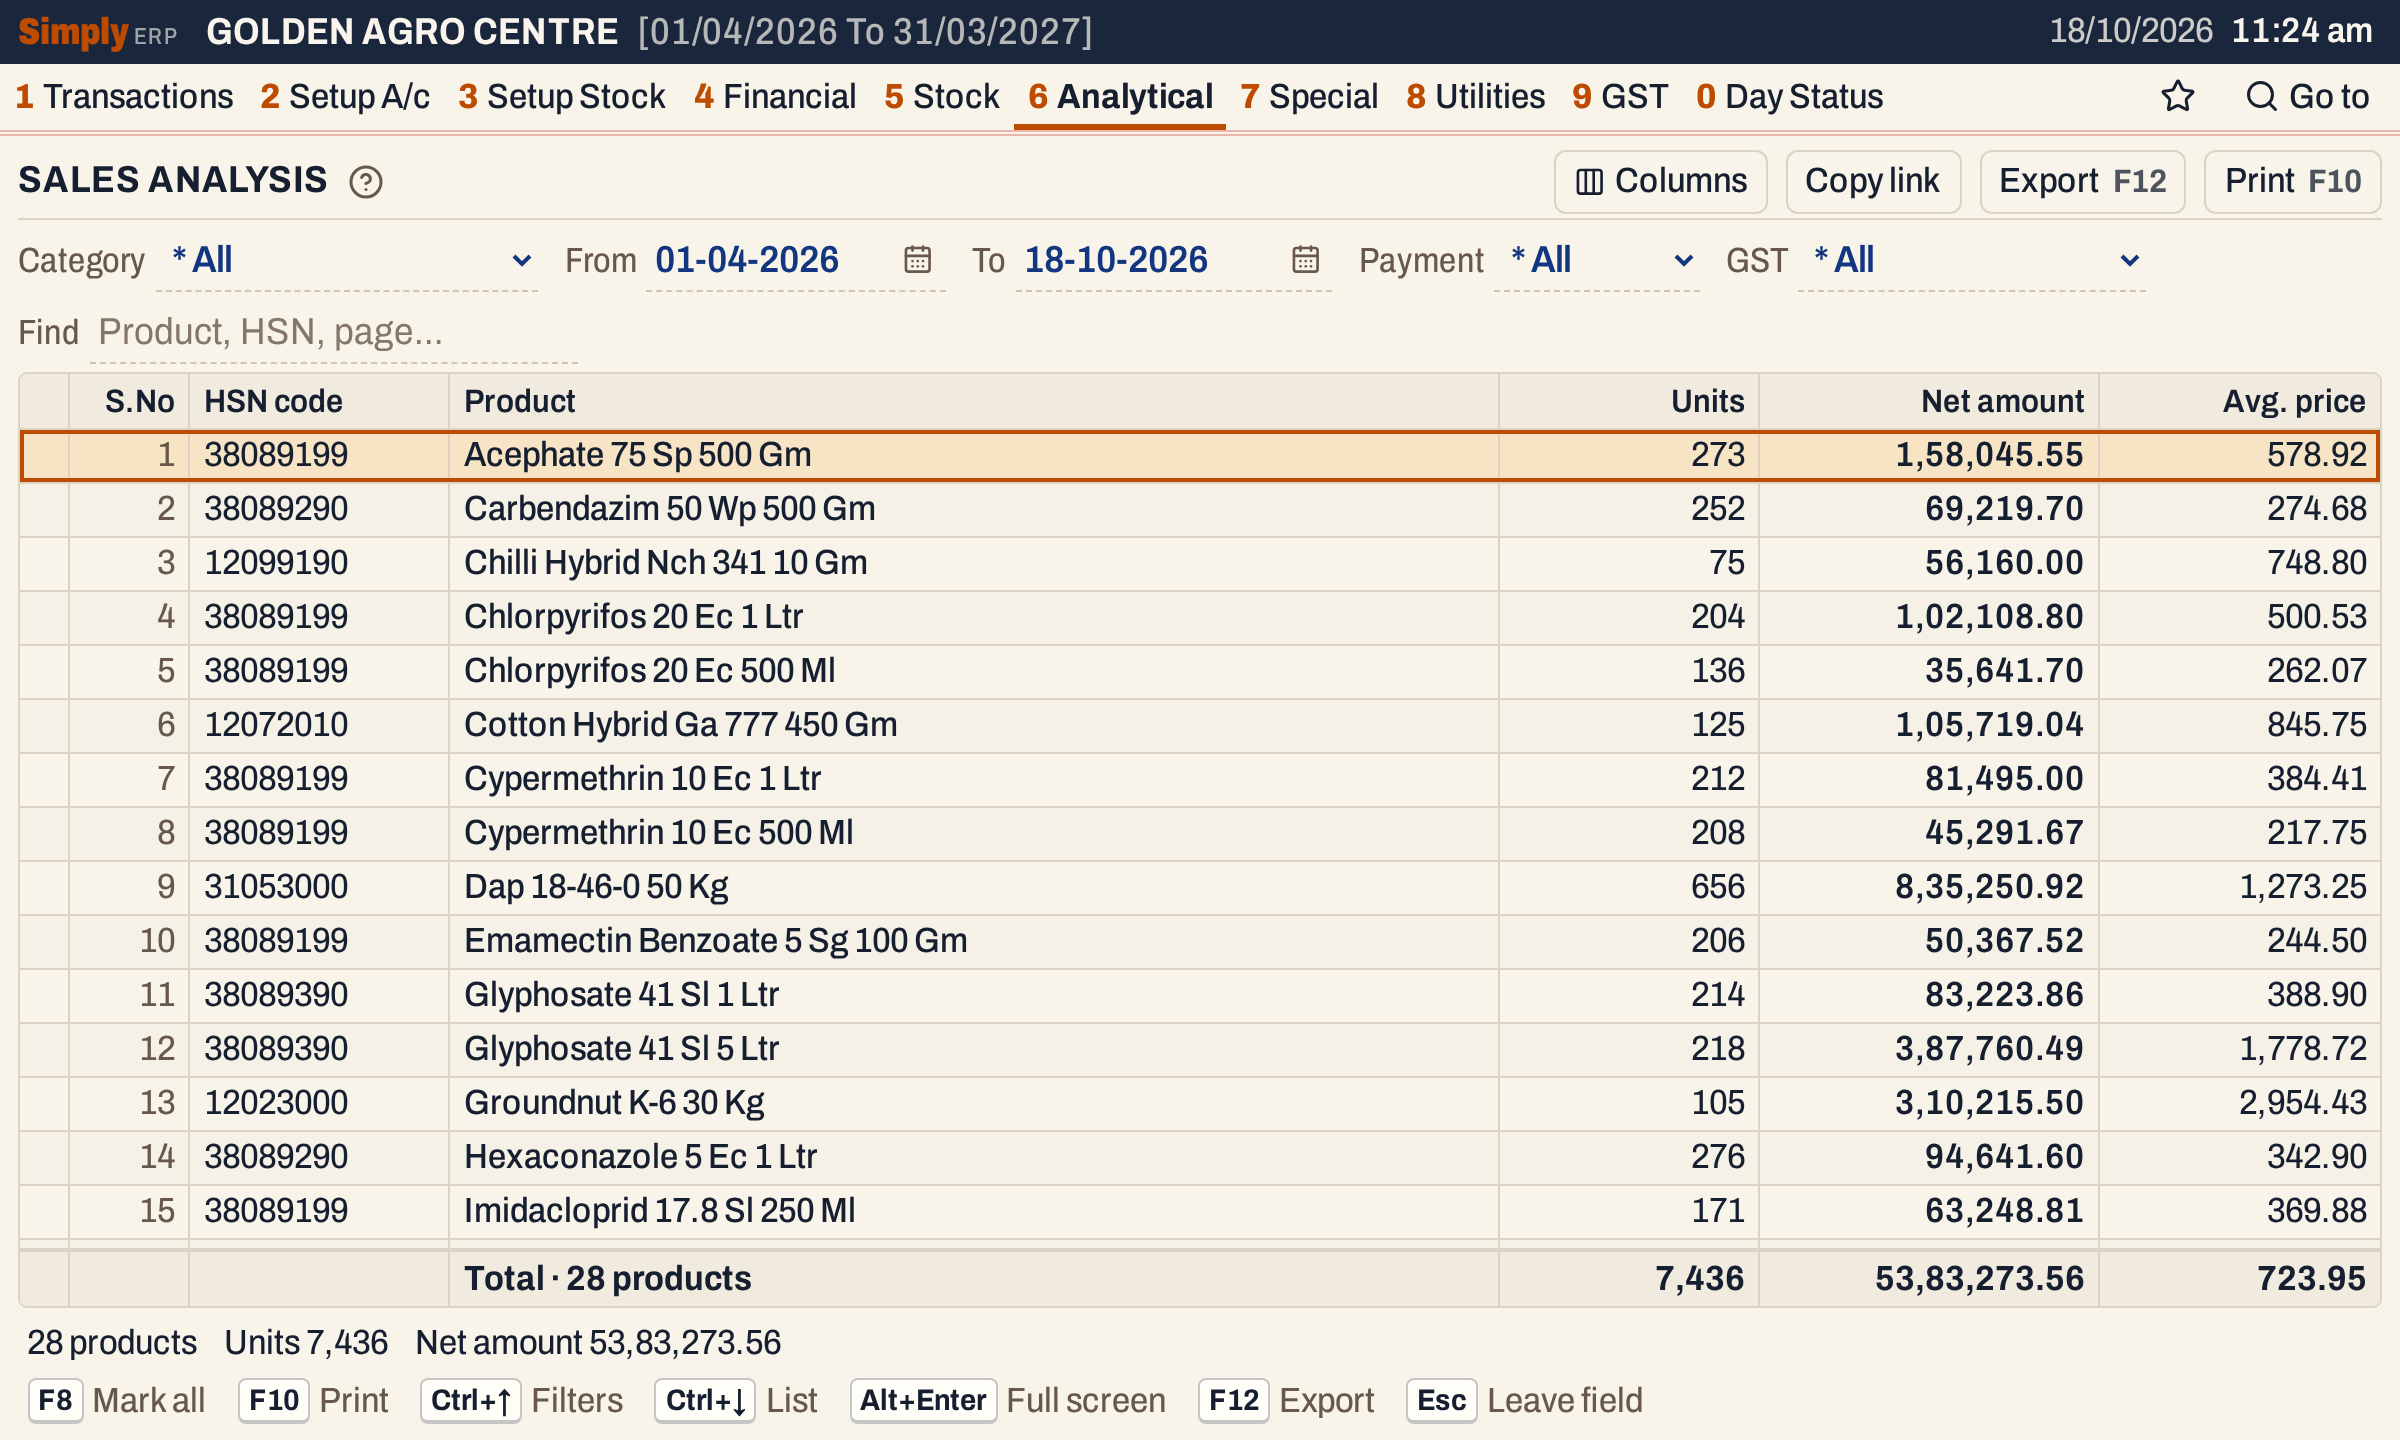 Each line is one product. Acephate 75 Sp 500 Gm sold 273 units for 1,58,045.55, an average of 578.92.
What it lists
One line for each product on the sale bills posted in the period. The report reads:
- sale bills, each on the date of the bill, with both the From and To days counted;
- the item lines of those bills with a quantity above zero. Discount, charge and other lines that are not items are not counted as products.
Sales returns are not read, so the units and amounts are not reduced by them. Goods delivered but not yet billed are not counted either. A product appears once for each HSN code and unit its bills use, so a product billed under two HSN codes has two lines.
Columns
| Column | What it shows |
|---|---|
| S.No | The line’s number in the current order. Hide it with Columns. |
| HSN code | The HSN code on the bill lines, in capitals. Sortable. Hide it with Columns. |
| Page | The product’s Reg. page, from the item’s details. It is shown only when at least one product in the list has one. Sortable. Hide it with Columns. |
| Product | The product’s name. Sortable. |
| Units | The quantity sold, added up over the bill lines. Sortable. |
| Net amount | The amount sold: before GST on bills to customers with a GSTIN, and including GST on the other bills. Shown in bold. Sortable. |
| Avg. price | The net amount divided by the units. Sortable. |
The totals line under the list counts the products, adds up the Units and Net amount, and gives the average price of the whole list. The status line repeats the count, the units and the net amount.
Choices
| Choice | What it does |
|---|---|
| Category | Only the products in this category, as set on the product. The default is * All. A product is counted in full, whatever its bills. |
| From, To | The period, both days included. They start at the financial year’s first day and the working date. The calendar offers only the days of the financial year. If you set one date past the other, the other follows it. |
| Payment | * All (the default), Cash or Credit: only the bills paid in cash, or only those on credit. Bills paid by card or wallet are counted under All only. |
| GST | * All (the default), Registered (customers with a GSTIN on the bill) or Unregistered. |
| Find | Shows only the products whose name, item code, HSN code or page matches what you type. Every word you type must match. |
Payment and GST narrow the bills before anything is added up. The report has no Tax choice: see How the figures are worked out.
 The choices of the report as it opens.
GST: registered and unregistered customers
Choose Registered to see only the bills to customers with a GSTIN. Here 28 products sold 3,471 units for 24,26,113.88.
 Registered customers only.
Choose Unregistered for the other bills. Here 3,965 units sold for 29,57,159.68.
 Customers without a GSTIN only.
Sort
Click a column title to sort by it, and click it again to reverse the order. The first click on Units, Net amount or Avg. price puts the largest first. Here the list is sorted by Net amount: Dap 18-46-0 50 Kg is first, with 656 units and 8,35,250.92.
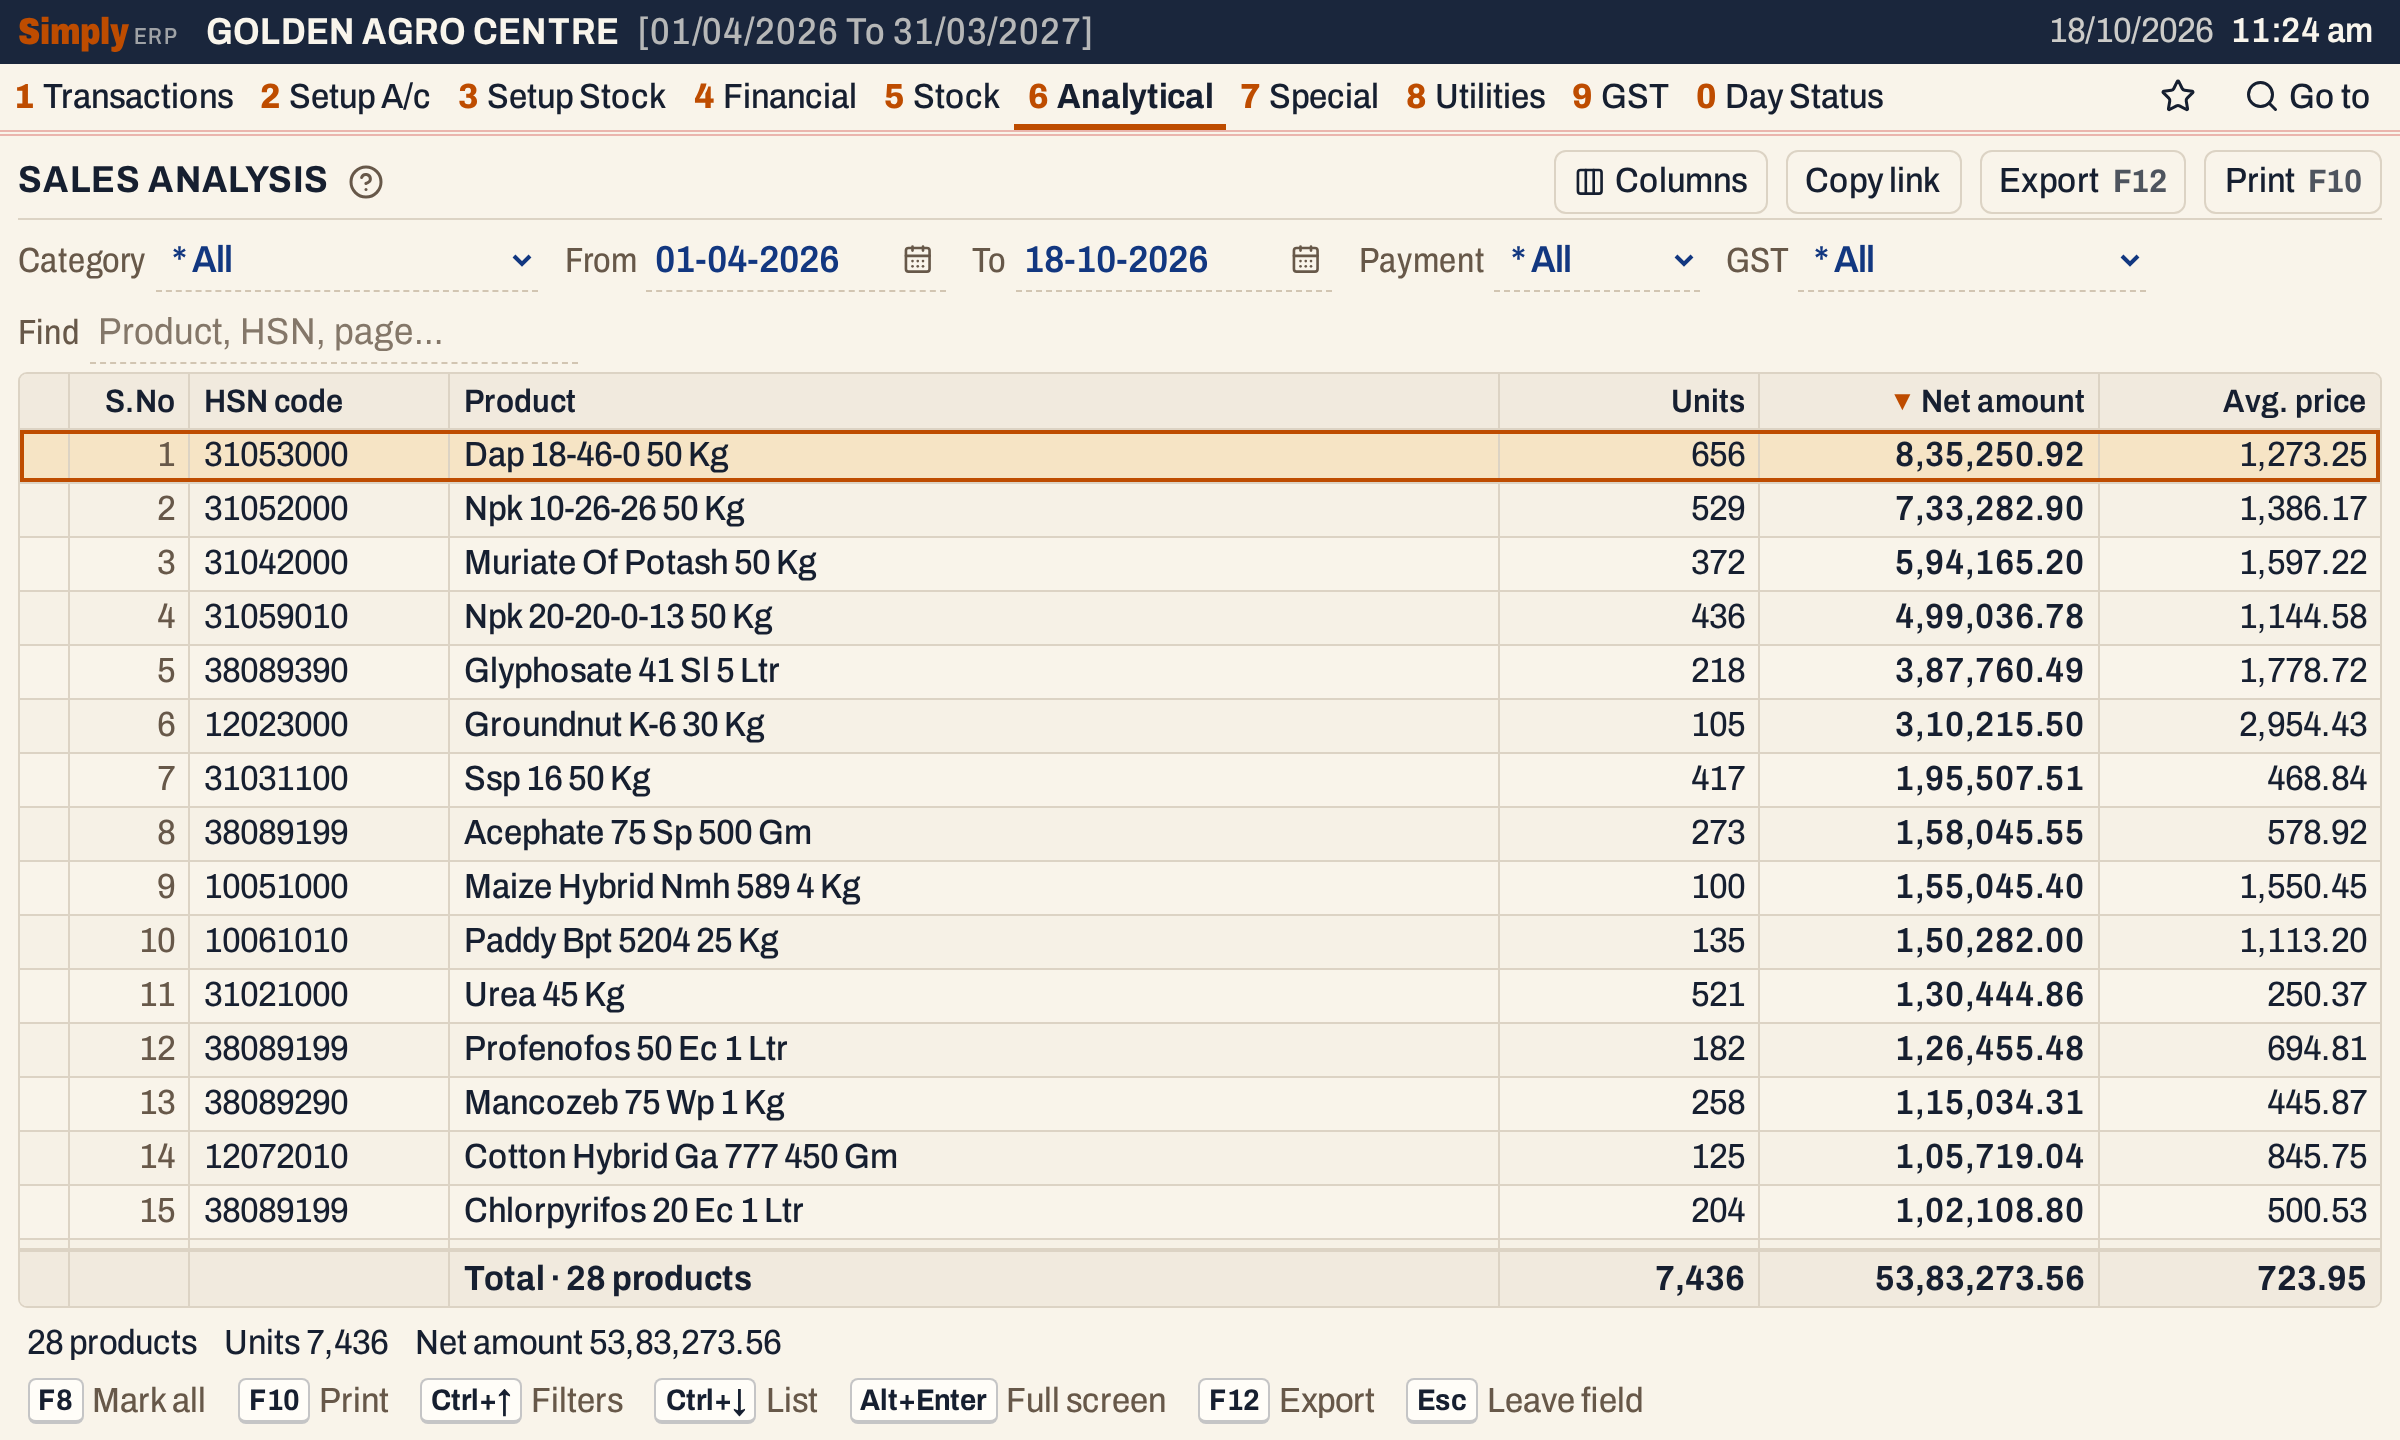 Sorted by Net amount. The arrow on the title shows the column the list is sorted by.
Find
Type in Find to narrow the list. Here the word acephate leaves one product, with its 273 units and 1,58,045.55.
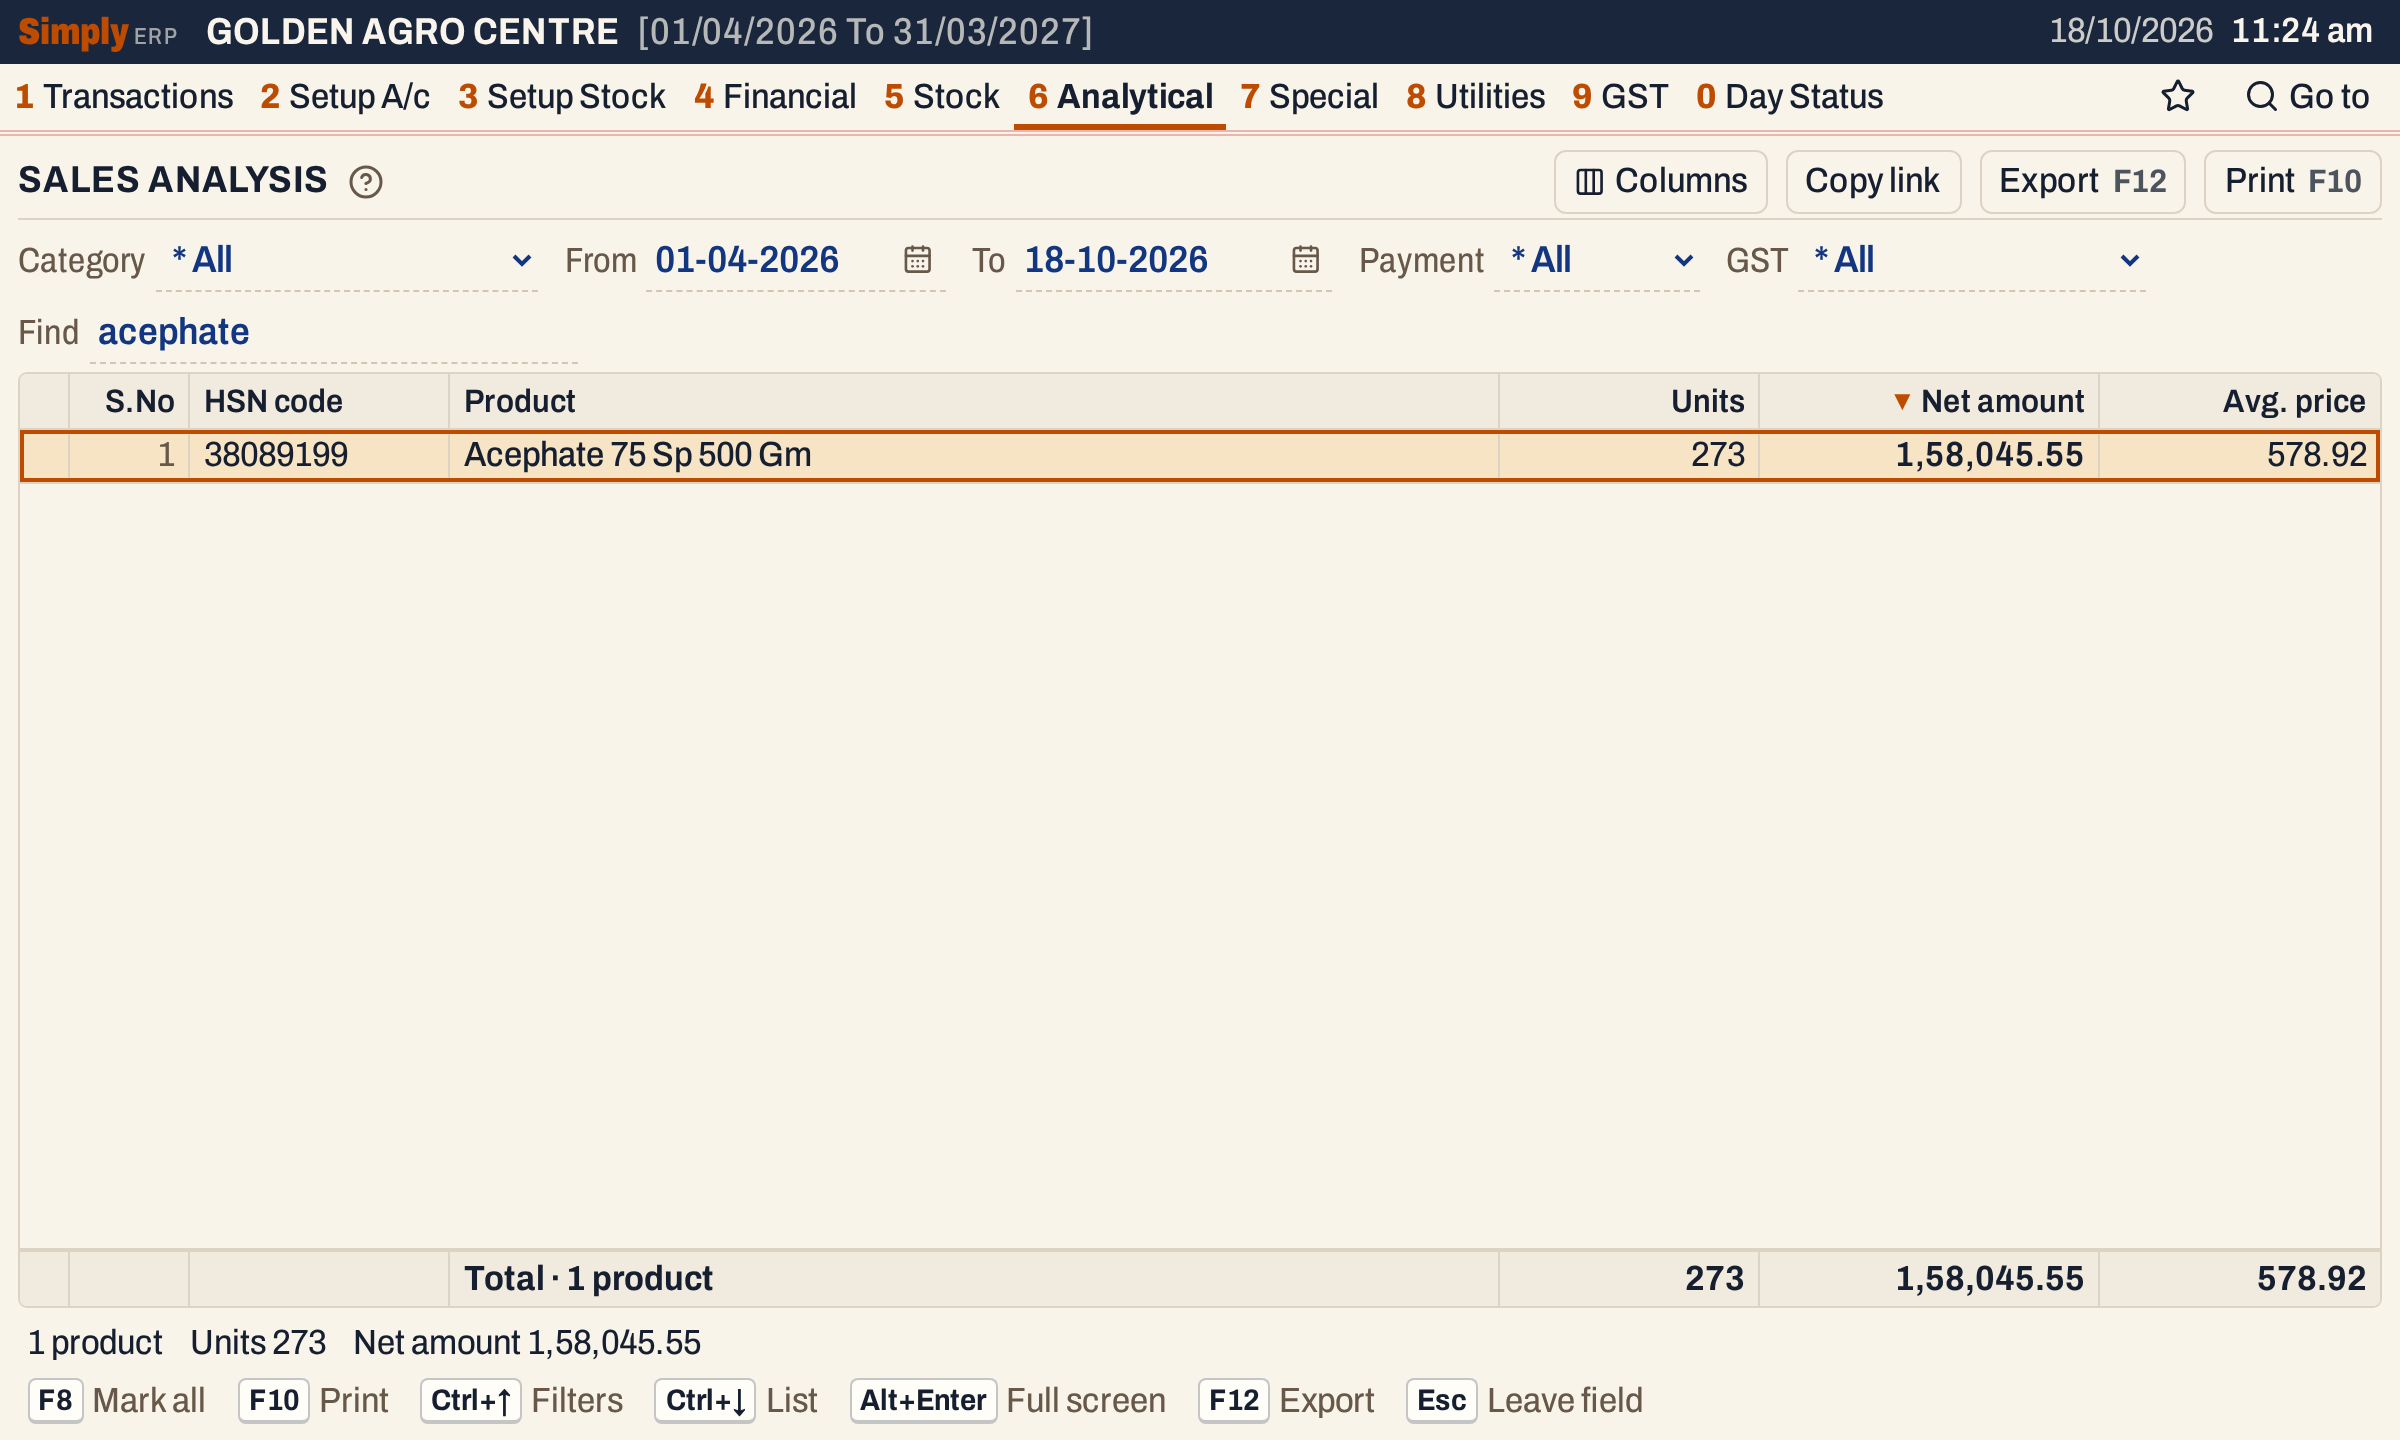 Find matches the name, item code, HSN code and page of each product.
How the figures are worked out
For each product, SimplyERP reads the item lines of the sale bills posted between From and To (both days counted), with a quantity above zero, after the Payment, GST and Category choices have been applied:
- Units = the quantity on those lines, added up.
- Net amount = each line’s amount, added up. A line’s amount is its taxable value, after discounts and without GST, when the bill is to a customer with a GSTIN. For any other customer it is the line’s billed amount, which includes GST.
- Avg. price = Net amount ÷ Units, shown to two decimals. The total line divides the total net amount by the total units. It is not an average of the product averages.
There is no Tax choice. Amounts for customers with a GSTIN are shown before GST and the other customers’ amounts with GST, so the Net amount total adds up the two. Choose GST to see each on its own: in the example, 24,26,113.88 for registered customers and 29,57,159.68 for the rest make the total of 53,83,273.56.
Sales returns are not taken off the figures. Category decides which products are listed; it does not change the amounts of a product.
 The totals line adds up the products; the status line repeats the count, the units and the net amount.
Open, mark, print and export
- Enter on a product opens the Sales Statement for that product, with the same period, Payment and GST choices. It lists the sales of the product, bill by bill. Alt+← there returns to the list.
- F2 marks a product and F8 marks every product on the screen. When any are marked, F10 prints only those, and the print says Marked products only.
- F10 prints the report as it is on the screen, under the title SALES ANALYSIS. Its heading gives the period and the category, and the choices in words: Cash bills, Credit bills, Registered customers or Unregistered customers. The print has the same columns with its own headings: HSN Code, P.No, Product Name, Sal.Qty, Avg.Price and Net Amount.
- F12 saves it as an Excel workbook.
- Alt+Enter gives the whole window to the list.
Updated 4 November 2026.